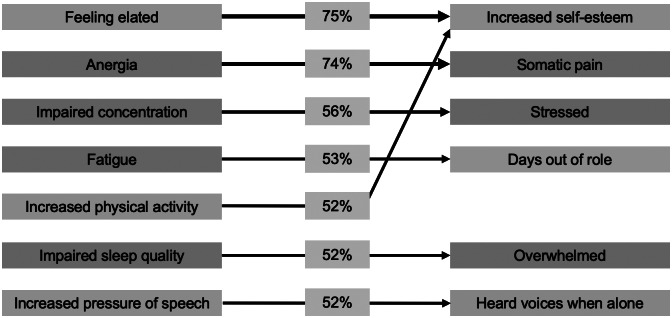
Figure 2.
Cross-item relationships among self-rated symptoms and impairment from the first dynamic Bayesian network. Only arcs present in ≥50% of 1,000 bootstraps are displayed. Line thickness and percentages represent the proportion of bootstraps each arc was present in. Colors represent domains (blue, anxious-depressive; green, hypo-manic; orange, psychotic-like; and pink, social support).

