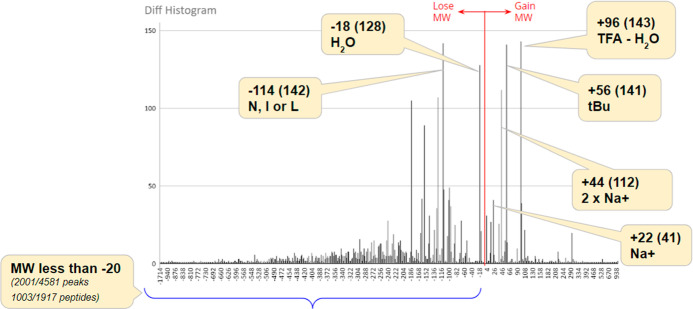
Figure 3.
Histogram of discrepancies between expected and measured peptide molecular weight. The chart is a histogram highlighting differences in the molecular weight of various peaks present in a representative spectrum compared to the desired peptide’s molecular weight. The values are rounded to the nearest 2. A difference of 0, which indicates an exact match, was removed from this chart for visualization purposes. Difference values higher than 0 indicate the molecular weight gained by the peptide. Difference values lower than 0 indicate that molecular weight dropped from the peptide. Possible explanations for various gains and losses are provided.

