
Figure 2.
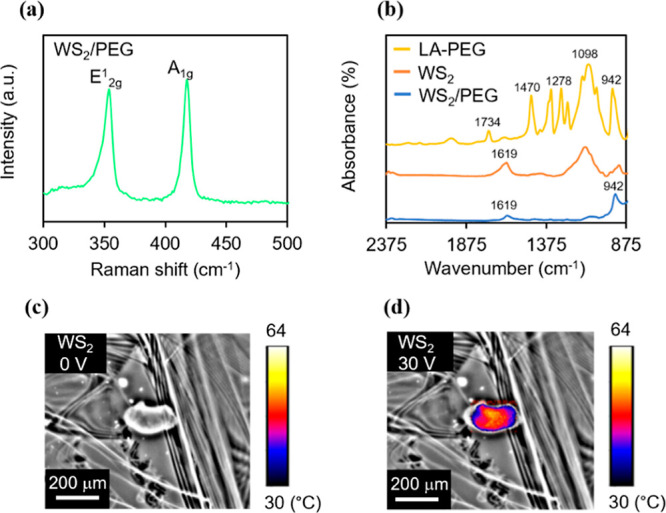
Characterization of WS2/PEG nanostructures and electrothermal characterizations for AC-pulse ETT applications. (a) Raman spectra of WS2/PEG. (b) FTIR spectra of LA-PEG, WS2, and WS2/PEG. (c,d) Thermal distributions of WS2 at bias voltages of (c) 0 and (d) 30 V. The thermal signal images are superimposed on the optical images to mark the heating points with thermal data.