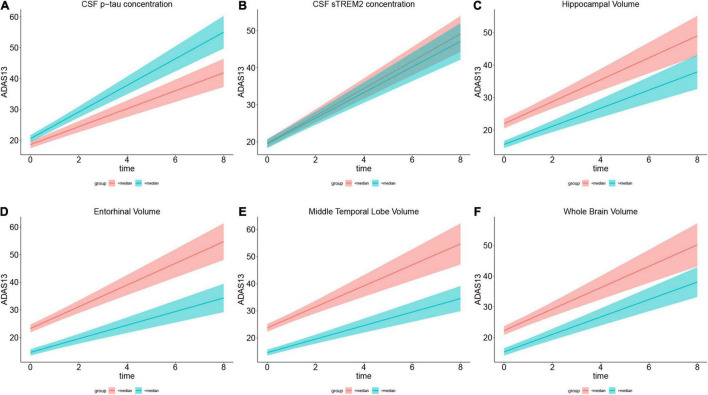
FIGURE 3.
Role of each biomarker in cognitive change measured by ADAS13. (A–F) Show the annual ADAS13 change in cognitive impairment population with Aβ-positive. For directly illustration, each plot compares ADAS scores between the subgroup who scored below the median (in red) and the subgroup who scored above the median (in green) on the variable in the plot title. (A) Shows higher CSF p-tau concentration has faster cognitive decline in 8-year follow-up. (B) Illustrates higher CSF soluble TREM2 concentration is associated with slower cognitive change. (C–F) Show larger specific brain region volume (including hippocampal, entorhinal, and middle temporal and whole brain) is associated with slower cognitive decline. Brain volumes are segmented from 3.0 T structural MRI.

