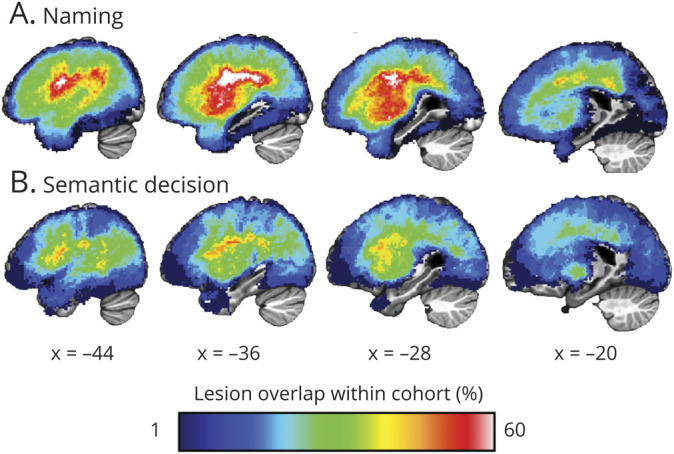
Figure 1. Serial Sagittal Slices Through the Left Hemisphere of Both Cohorts Showing the Overlap of Anatomical Lesion Tracings.

Lesion overlap for the cohort who underwent the naming task (A) and the semantic decision task (B). Percent of lesion overlap within each cohort is indicated by the spectrum color.
