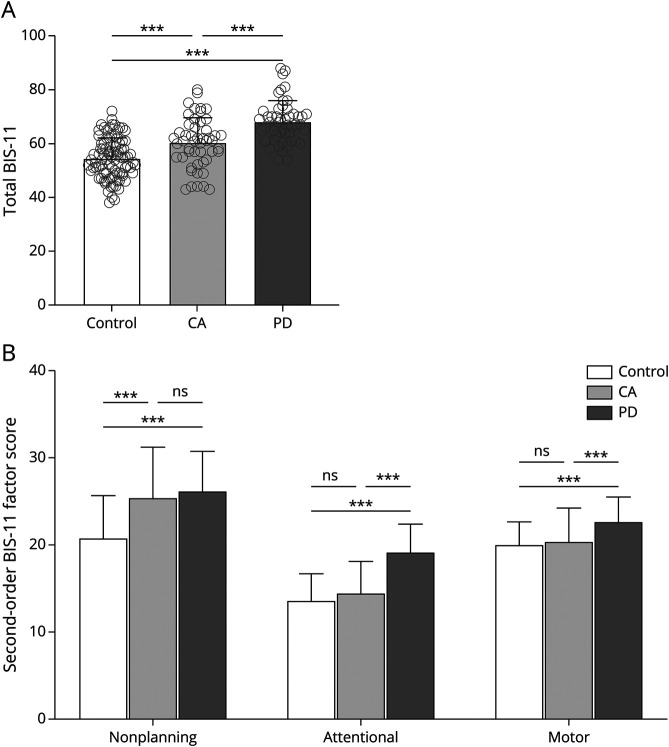
Figure 1. Comparison of BIS-11 Scores Between Diseased Groups and Controls.
Mean group responses of controls (n = 90), participants with cerebellar ataxia (CA) (n = 50), and participants with Parkinson disease (PD) (n = 50) for (A) total Barratt Impulsivity Scale (BIS-11) score and (B) second-order factors. Individual scores are shown with gray circles. Multiple-comparisons post hoc test p values after a false discovery rate correction are shown. ns = not significant. *p < 0.05, **p <0.01, ***p < 0.001.

