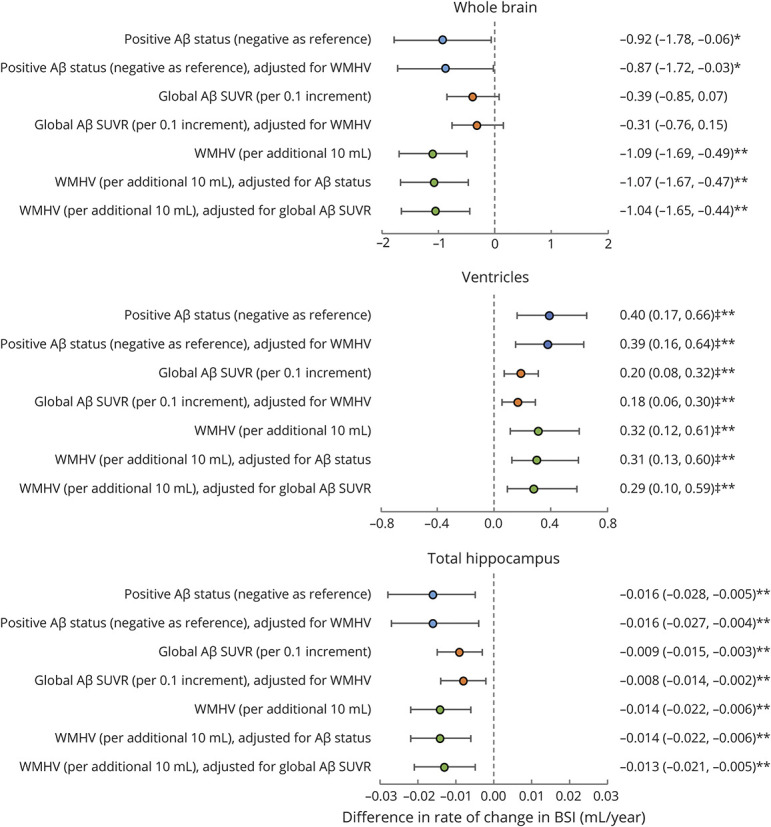
Figure 1. Forest Plot Showing Coefficients and 95% CIs for Associations of Baseline Aβ and WMHV With Rates of Neurodegeneration Quantified From MRI in Cognitively Normal Participants.

Aβ = β- amyloid; BSI = boundary shift integral; SUVR = standardized uptake value ratio; WMHV = white matter hyperintensity volume. All models were adjusted for sex, age at baseline scan, and total intracranial volume. *p ≤ 0.05; **p ≤ 0.01. ‡Bias-corrected and accelerated bootstrap 95% CIs.
