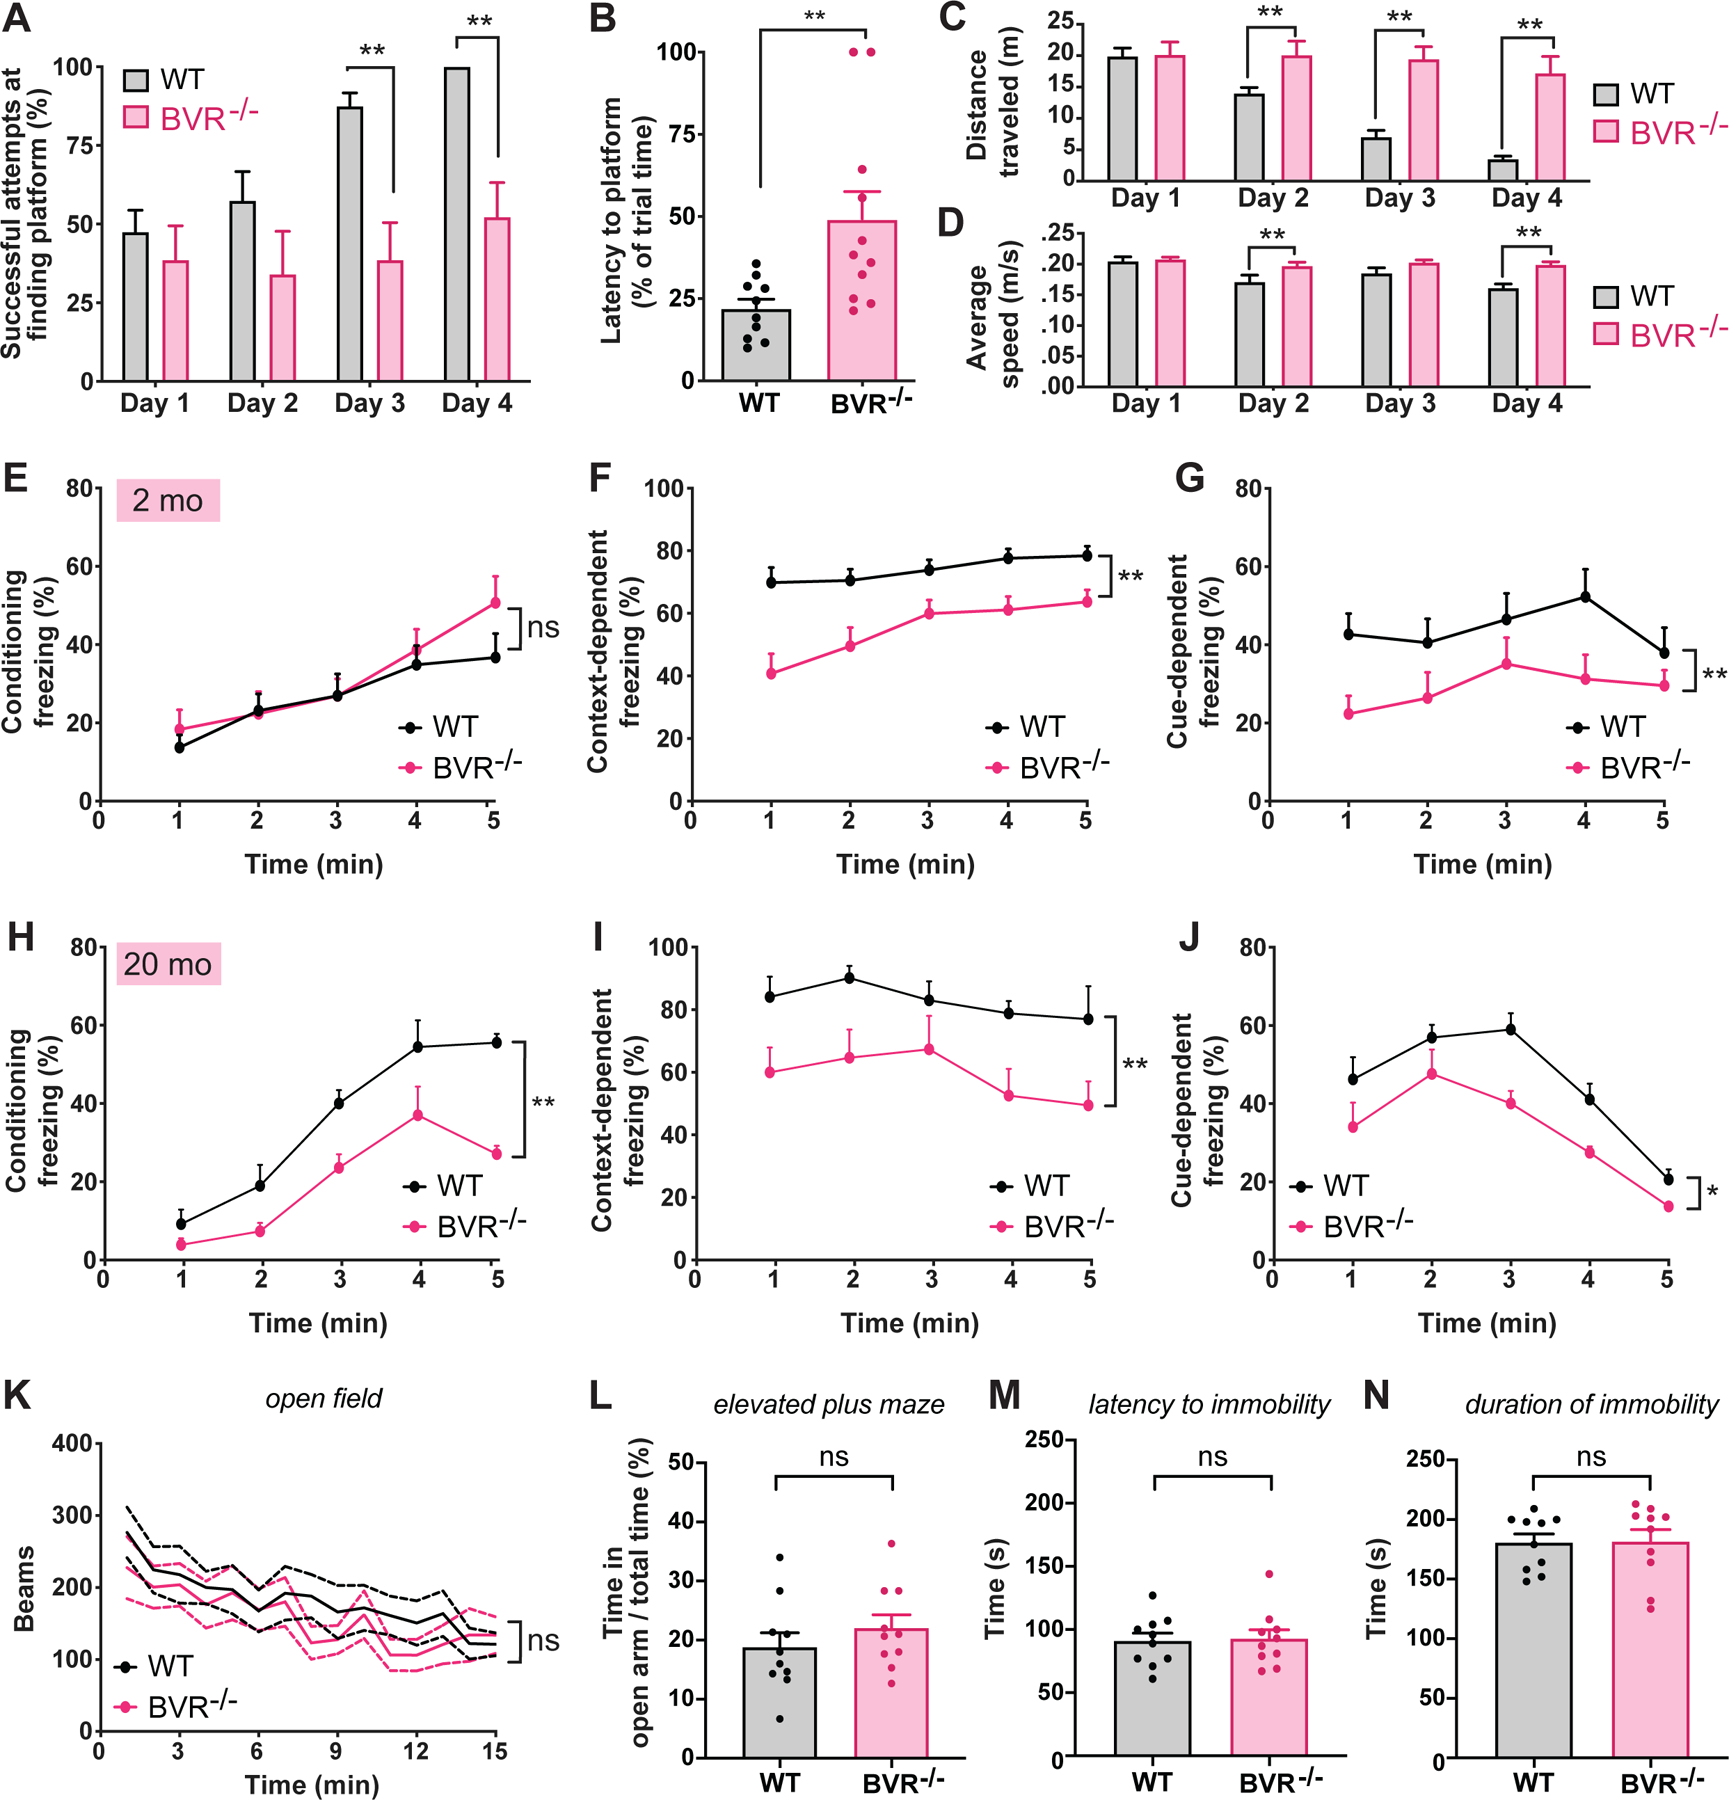
Figure 1. BVR−/− mice exhibit impaired learning and memory, but no anxiety or despair.

(A to D) Analysis of WT and BVR−/− mice performance in Morris water maze: (A) Percent of successful attempts to arrive at platform during trials on days 1 to 4; (B) latency to arrive at platform on test day 5; (C and D) distance traveled (m) and average swim speed (m/s) during trials on days 1 to 4. Points represent individual mice; n = 10 WT and 11 BVR−/− mice. (E to J) WT and BVR−/− mice performance in context- and cue- dependent fear conditioning at 2 months (E to G) and 20 months old (H to J), calculated as (E and H) percent of time that mice remain frozen during training trial in which a series of tone-shock pairs; (F and I) percent of time that mice remain frozen when re-exposed to training chamber the following day without delivering any shocks; and (G and J) percent of time that mice remain frozen when re-exposed to training tone in a new chamber the following day without delivering any shocks. n = 14 WT and 10 BVR−/− mice. Points represent mean of data. (K) Open field locomotor activity of WT and BVR−/− mouse over time. n = 5 WT and 5 BVR−/− mice. (L) Percent of time WT and BVR−/− mice spent in the open arms of the elevated plus maze. n = 10 WT and 10 BVR−/− mice. Points represent individual mice. (M and N) WT and BVR−/− mice performance in forced swim test. Latency to (M) and duration of (N) immobility, defined as the absence of movement or paddling with only a hind leg to keep head above water. n = 10 WT and 10 BVR−/− mice. Points represent individual mice. In (A to J, and L to N) Mean ± SEM depicted. In (K), mean ± 95% CI is depicted. * P < 0.05, ** P < 0.01, and ns = P > 0.05, by two-tailed unpaired Student’s t-test.
