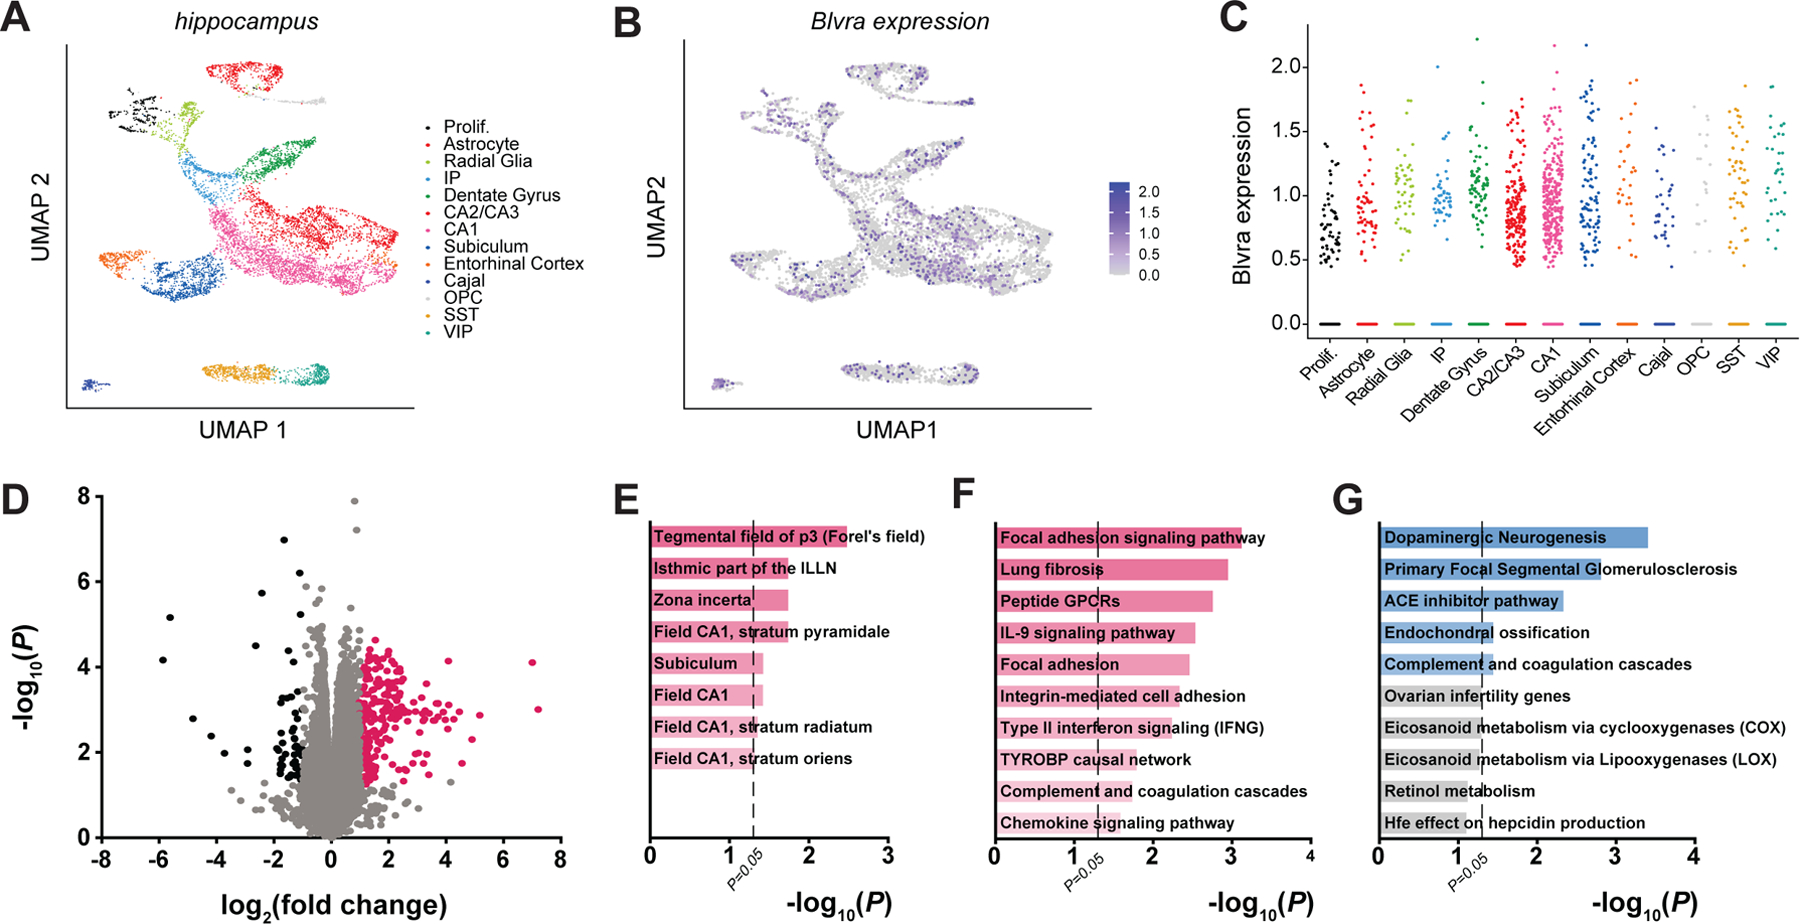
Figure 3. RNA-sequencing reveals downregulated focal adhesion signaling in BVR−/− hippocampi.

(A and B) UMAP plots of (A) all WT hippocampal cells, colored by cell cluster type (Prolif, proliferative cells; IP, intermediate progenitors; Cajal, Cajal-Retzius cells; OPC, oligodendrocyte precursor cells; SS, SST+ interneurons; VIP, VIP+ interneurons), and of the expression of Blvra (purple) (B) throughout the hippocampus and (C) in each hippocampal cell type of WT mice, analyzed from single-cell RNA-sequencing data reported elsewhere (27). Data points represent individual cells. (D) Volcano plot of transcriptome sequencing of 3 WT and 3 BVR−/− hippocampi. Points represent individual genes. Black points indicate significantly downregulated genes (FDR < 0.5, log2(fold change) ≤ −1), pink points indicate significantly upregulated genes (FDR < 0.5, log2(fold change) ≥ 1), and gray points are not differentially expressed between genotypes. Notable NRF2-target genes are labeled. (E) Genetic network analysis of neuroanatomic and neural cell-type signatures that are downregulated in BVR−/− hippocampi from transcriptome sequencing in (D). (F and G) Gene ontology analysis of molecular pathways that are (F) downregulated and (G) upregulated in the transcriptome sequencing in (D).
