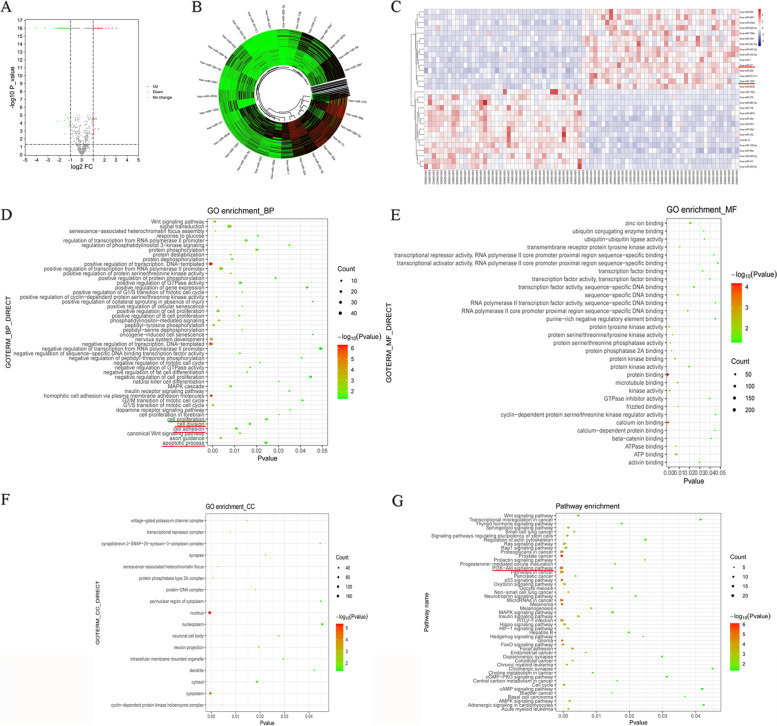
Fig. 1.
Expression, GO and KEGG analysis of DE-miRNAs in arecoline-induced cancer. A Volcanic plot of the GSE45238 data comparing patients with arecoline-induced cancer and healthy controls. Significantly upregulated miRNAs are indicated with red dotes, while downregulated miRNAs are indicated with green dotes. The dashed line illustrates the cut-off for significance (p < 0.01; T-test). B Circular cluster map. Upregulated miRNAs are indicated with red dotes, while downregulated miRNAs are indicated with green dotes. C Heat map of the top 15 up- or downregulated miRNAs. Red markers upregulation; blue, downregulation. D Enrichment of DE-miRNAs in GO biological processes (BPs). E Enrichment of DE-miRNAs in GO molecular functions (MFs). F Enrichment of DE-miRNAs in GO cellular components (CCs). G KEGG pathway enrichment analysis of DE-miRNAs. Node color and size reflect the log10 (p value) and count, respectively

