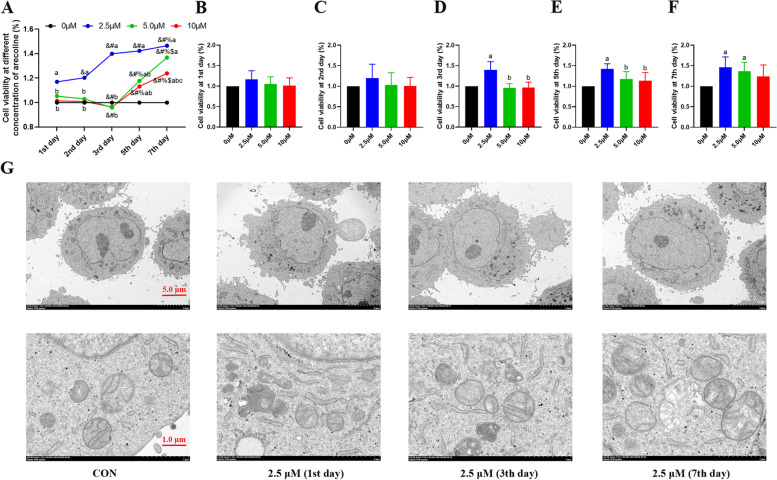
Fig. 4.
Arecoline treatment affects the cell viability and ultrastructure of HepG2 cells. A Changes in viability of HepG2 hepatoma cells treated with the indicated concentration of arecoline. B-F Quantification of the changes in HepG2 cell viability after treatment with the indicated concentration of arecoline on 1st day B, 2nd day C, 3rd day D, 5th day E and 7th day F. G Transmission electron microscopy images highlighting the ultrastructural changes in HepG2 hepatoma cells treated the indicated concentrations of arecoline. Vs 1st d, &p < 0.05; vs 2nd d, #p < 0.05; vs 3rd d, %p < 0.05; vs 5th d, $p < 0.05. Vs 0 μM treatment group, ap < 0.05; vs 2.5 μM treatment group, bp < 0.05

