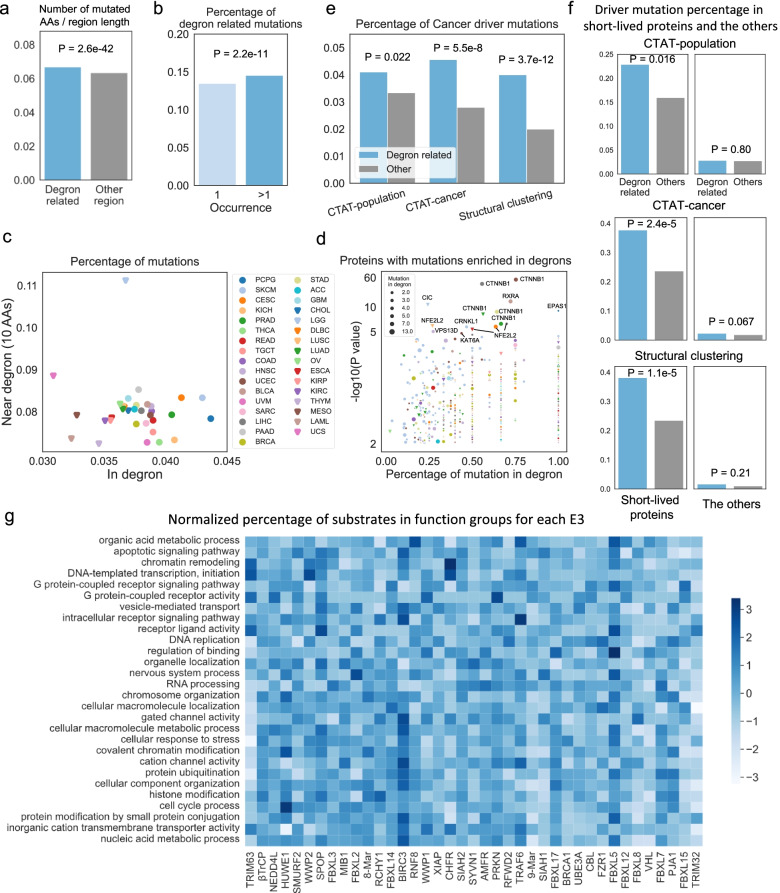
Fig. 6.
Characterizing TCGA mutations in predicted degrons. a Comparison of mutations occurred in degron-related regions (inside and flanking 10 AAs) and other regions, the rates were calculated by dividing the number of AAs with mutations in TCGA in the regions by the number of all AAs of the regions. b Comparison of percentage of degron-related mutations between recurrent mutations (> = two tumor samples) and other mutations. c Percentage of mutations in degrons and near degrons of 33 cancer types. d Proteins with mutations enriched in degrons in 33 cancer types, P values were calculated using Fischer’s exact test. Proteins with more than one mutation and P value less than 0.01 were shown in the scatter plot. e Cancer driver percentage of mutations in degron-related regions and other regions. CATA-population distinguishes pathogenic mutations from benign polymorphisms on a population level; CATA-cancer distinguishes between drivers and passenger somatic mutations; structural clustering leverages information from protein structures to predict drivers. f Driver mutation percentage in degron-related regions and other regions of short-lived proteins and the other proteins. g Normalized percentage of substrates in each function group for each E3. Percentages of substrates in each function group were normalized to Z-scores by rows. The bluer the color, the more substrates in this pathway are regulated by the E3. All P-values in this figure were calculated using Fischer’s exact test

