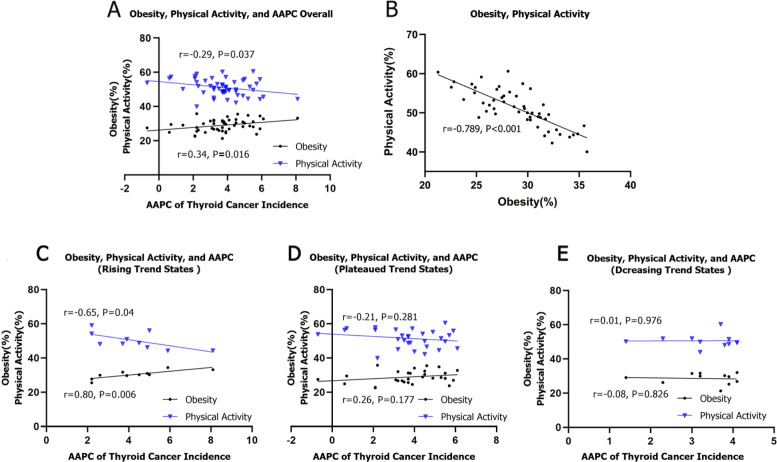
Fig. 3.
The correlation between obesity and physical activity level, thyroid cancer AAPC. The abscissa represents state-level the average obesity prevalence during 2011–2017; the ordinate represents the average physical activity ratio at the state-level; the Black dots and blue triangle represent states. A: Correlation between the AAPC of the thyroid cancer and physical activity level, obesity; B: Correlation between physical activity level and obesity; C: Correlation between AAPC of the Thyroid Cancer and physical activity level, obesity in rising trend states; D: Correlation between AAPC of the Thyroid Cancer and physical activity level, obesity in plateaued trend states; E: Correlation between AAPC of the Thyroid Cancer and physical activity level, obesity in decreasing trend states

