
Fig. 1 |. Flowchart of DEMO-EM.
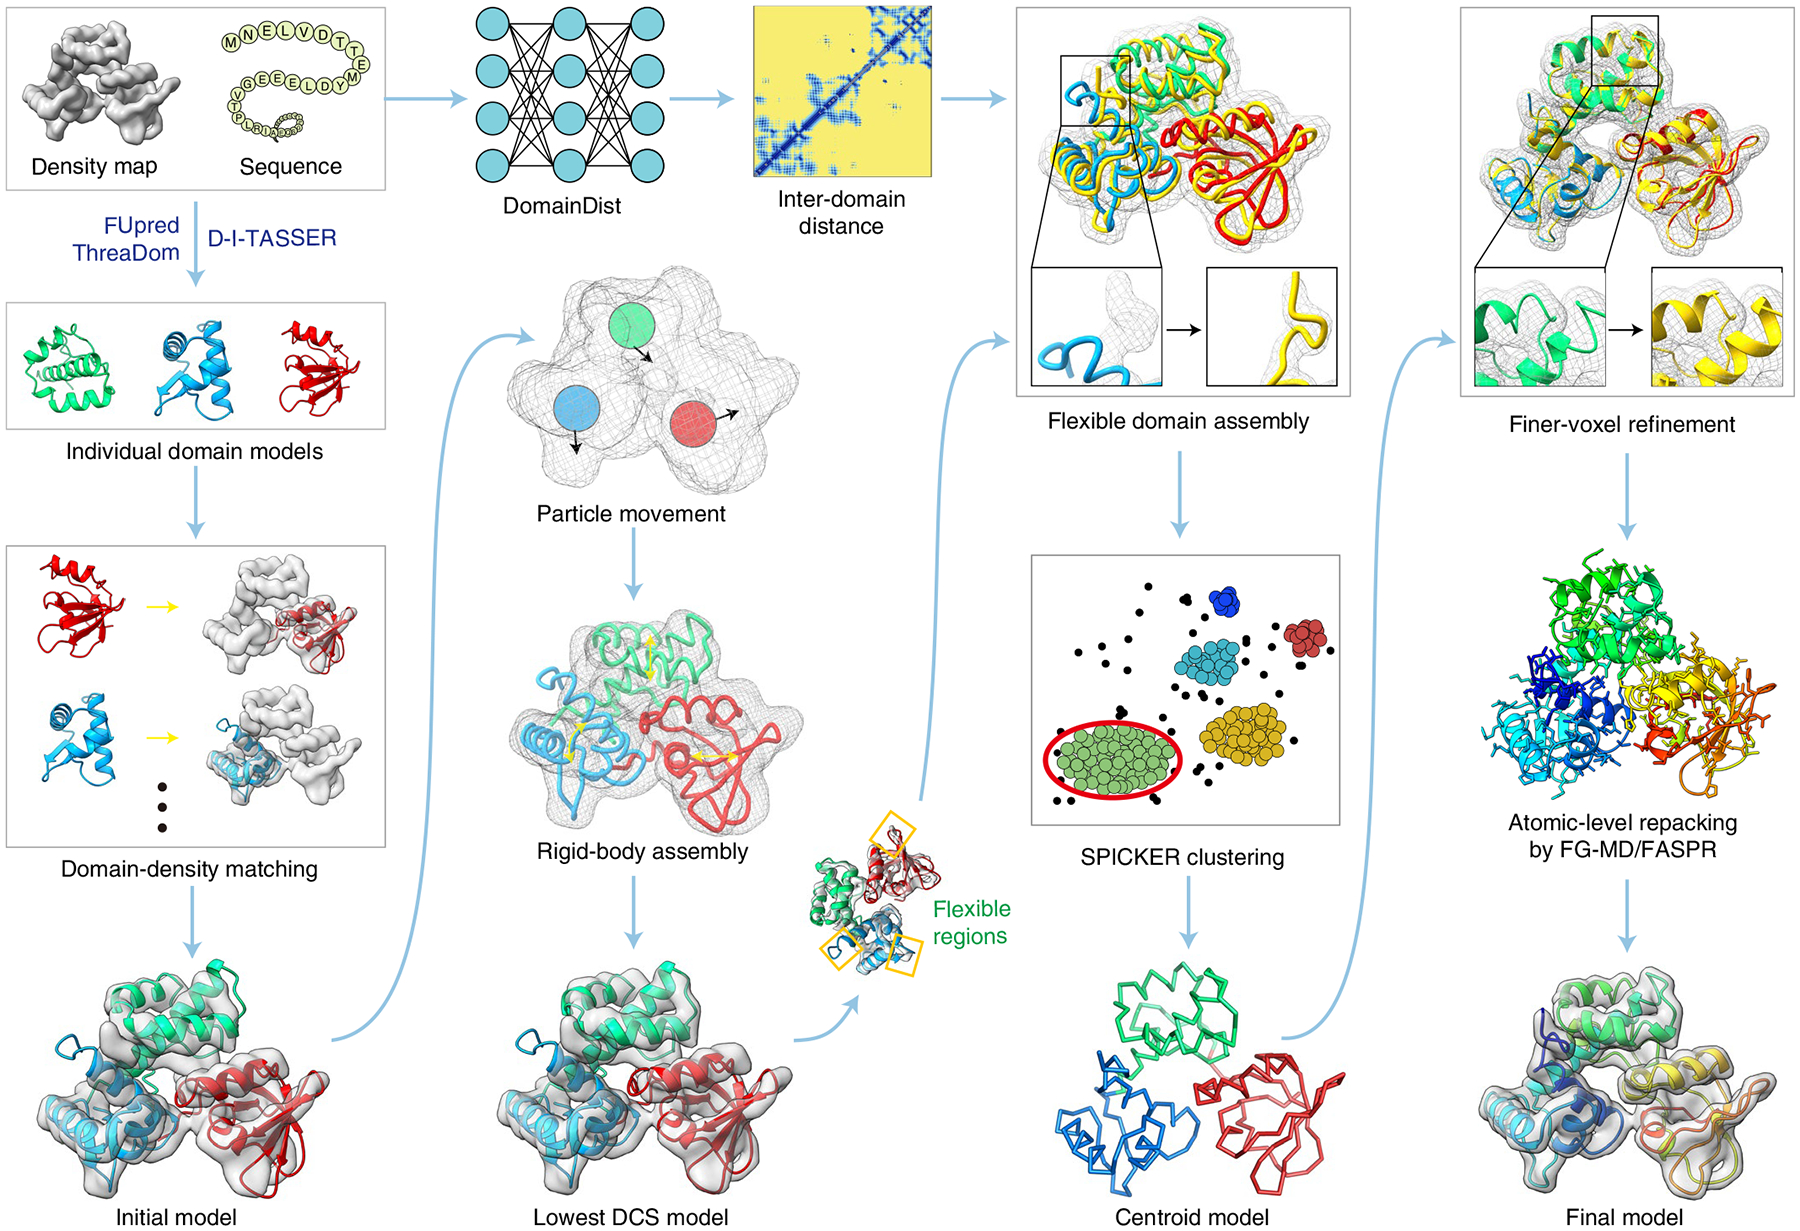
The flowchart is illustrated with a three-domain protein from the iron-dependent regulator of Mycobacterium tuberculosis (pDB ID 1fx7A). Starting from the query sequence, domain boundaries are first predicted by FUpred14 and ThreaDom15, and models of each domain are generated by D-I-TASSEr16. Meanwhile, inter-domain distances are predicted with a deep convolutional neural-network predictor DomainDist. Second, each of the domain models is independently fit to the density map by quasi-Newton searching. Third, the initial full-length models are optimized by a two-step rigid-body rEMC simulation to minimize the DCS) between the density map and full-length model (equation (1)). Fourth, the lowest DCS model selected from the rigid-body assembly simulations is refined by flexible assembly with atom-, segment- and domain-level refinements using rEMC simulation guided by the DCS, inter-domain distance profiles and a knowledge-based force field, with the resulting decoy conformations clustered by SpICKEr53 to obtain a centroid model. Finally, the flexible assembly simulation is performed again for the full-atomic model with constraints from centroid models adding to the energy, and the final model is created from the lowest-energy model after side-chain repacking with FASpr54 and FG-MD18.