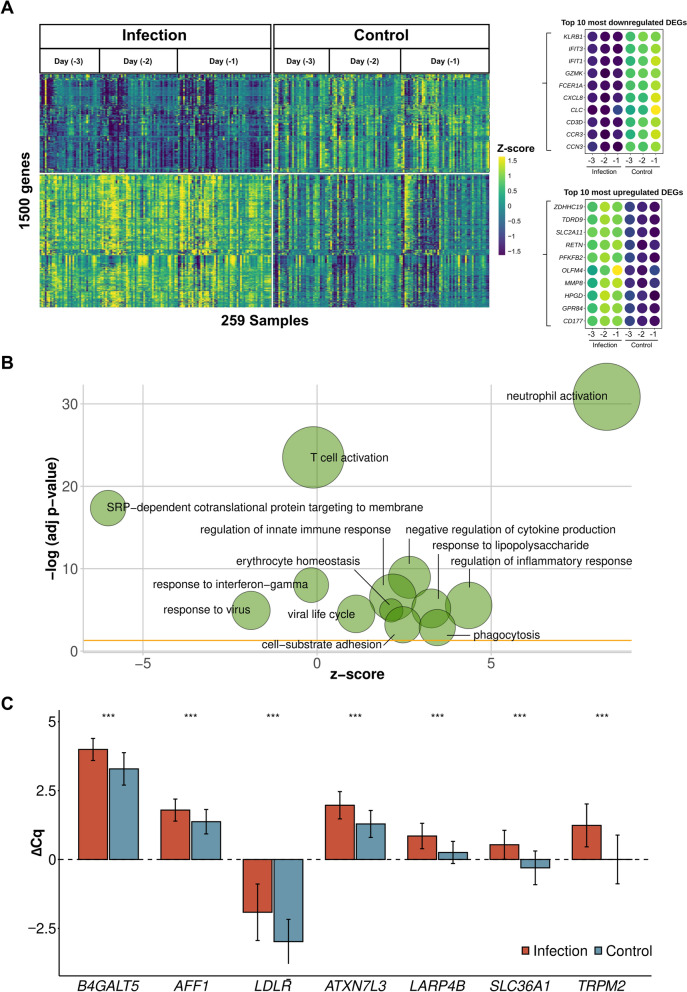
Fig. 2.
Gene expression analysis for infection versus healthy postoperative controls. A Expression profile of 1500 differentially expressed genes with the highest absolute fold change. The top ten up- and downregulated genes are indicated separately. B Top enriched Gene Ontology categories based on 1500 differentially expressed genes with the highest fold change as shown in Fig. 2A). Node sizes indicate a number of genes per shown category. Fold change is indicated for each displayed gene node. C RT-qPCR values for 8 genes originating from classifying infection versus no infection based on microarray-based expression data. ΔCq value indicates PCR cycle quantifications according to ΔCq = Cq(reference) - Cq(target gene). Wilcoxon test derived significance level is indicated (***p≤0.001, ns: not significant). Error bars show standard error of the mean. N(samples of infected patients) = 139, N(samples of control patients) = 144

