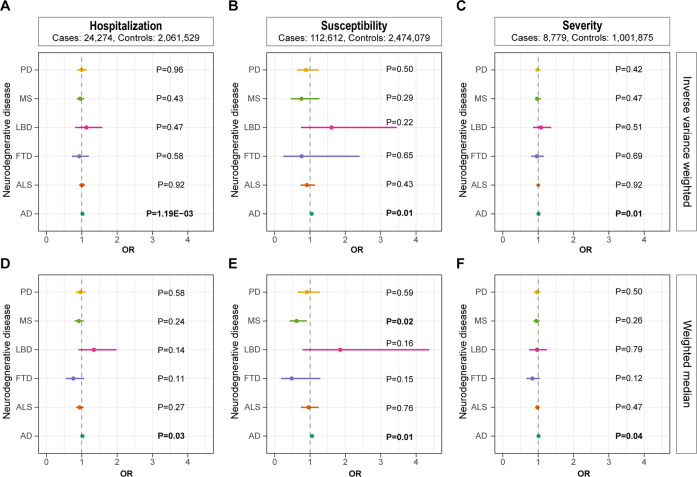
Fig. 2. Forest plot showing results from the Mendelian randomization analysis.
Results from the Mendelian randomization (MR) analysis to evaluate causal role of A hospitalization, B susceptibility, and C severity of COVID-19 in neurodegenerative disorders using the inverse variance weighted method. Results from the MR analysis to evaluate potential causal role of D hospitalization, E susceptibility, and F severity of COVID-19 in neurodegenerative disorders using the weighted median method. Estimates are per 1 standard deviation (SD) increase in the trait. Bold P value denotes nominal association (P < 0.05).

