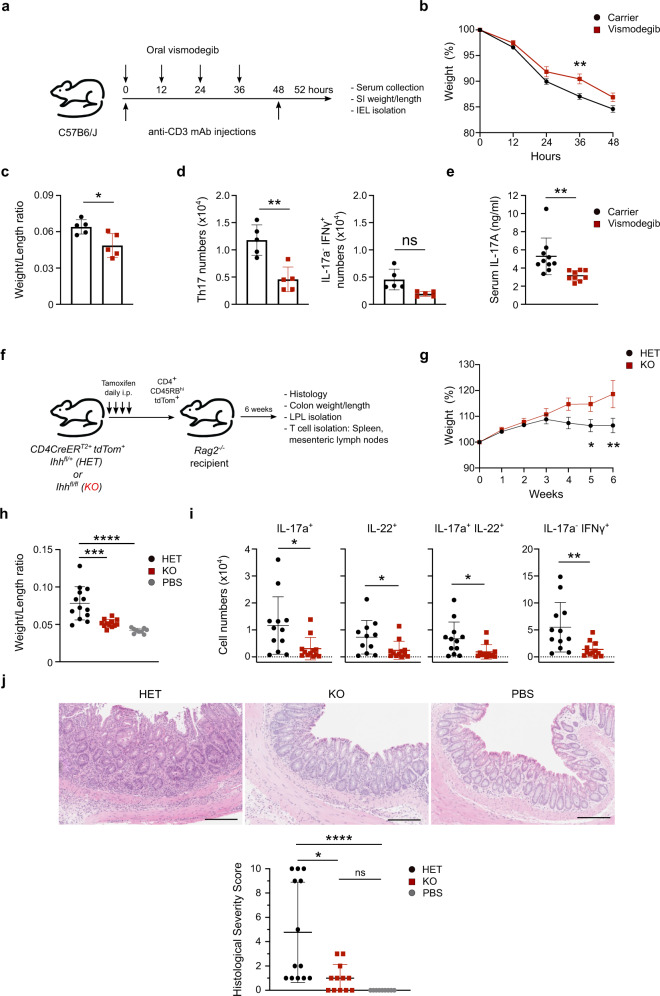
Fig. 6. Hh signaling is critical for Th17 responses in vivo.
a C57BL/6 mice were injected i.p. with 20 µg anti-CD3 monoclonal antibody (Clone: 145-2C11) at 0 and 48 h and dosed every 12 h by oral gavage with 100 mg/kg vismodegib or carrier control. Mice were harvested at 52 h. b Weight loss during the course of the experiment, relative to starting weight on day 0 (=100%). Pooled data from three independent experiments. c Small Intestine weight/length ratios. Representative data shown from one of three independent experiments. d IEL Th17 and IFNγ+ IL-17a− CD4+ T cell numbers. Representative data shown from one of three independent experiments. Gating strategy is shown in Supplementary Fig. 8. e Serum IL-17a concentrations at 52 h. Pooled data from three independent experiments. f Rag2−/− mice were injected i.p. with 4 × 10⁵ CD45RBhi CD25neg tdTom+ CD4+ T cells isolated from the spleens and peripheral lymph nodes of tamoxifen-treated CD4CreERT2Cre Ihhfl/+ tdTom+ (HET) or CD4CreER T2 Ihhfl/fl tdTom+ (KO) mice. Mice were harvested at 6 weeks. g–j Pooled data from three independent experiments shown. g Weight loss during the course of the experiment , relative to starting weight on day 0 (=100%). h Colon weight/length ratios. (i) Numbers of IL-17a+, IL-22+, IL-17a+ IL-22+, IFNγ+ IL-17aneg T cells isolated from colonic lamina propria. Gating strategy is shown in Supplementary Fig. 9. j Panels on the top show representative H&E staining of the recipient mouse colons. The panel on the bottom shows the quantification of histological severity scored blindly by a gastroenterologist. Scale bars: 200 μm. Data are means +/− SEM (b, g). Rest are means +/− SD. p-values were calculated using an unpaired two-tailed Student’s t test. *p < 0.05, **p < 0.01, ***p < 0.001. p-values were calculated for panels (c, d, e, i) using an unpaired two-tailed Student’s t test, j using a Kruskal–Wallis test, h a one-way ANOVA, or b, g a two-way ANOVA with Sidak correction. *p < 0.05, **p < 0.01, ***p < 0.001. ns = not statistically significant. Source data are provided in the source data file.

