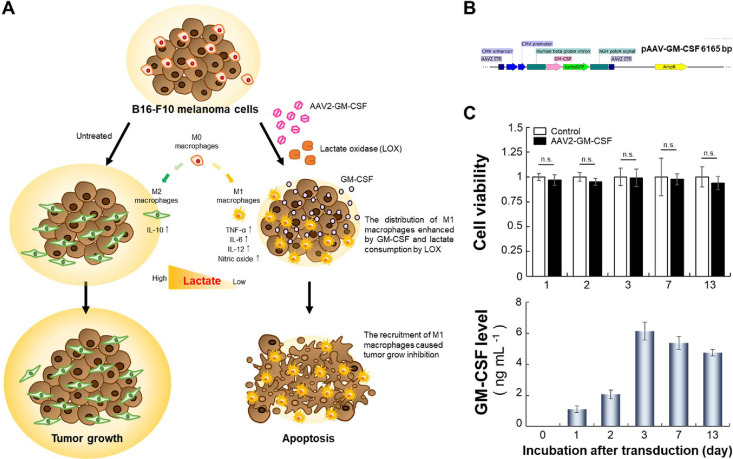
Figure 1.
Macrophage polarization induced by AAV2-GM-CSF. (A) Schematic of GM-CSF production by cancer cells infected with AAV2-GM-CSF combined with lactate oxidase (LOX) for the promotion of tumor-suppressing M1 macrophage recruitment. Specifically, LOX oxidized cancer cell-secreted lactate, leading to the conversion of tumor-promoting M2 macrophages into M1 macrophages. (B) Plasmid map of pAAV-GM-CSF (size: 6165 base pairs). (C) Top: cell viability of B16-F10 cells after infection with AAV2-GM-CSF. Cell viability is given as the percentage of viable cells remaining after treatment for 1, 2, 3, 7, or 13 days compared with the percentage of viable unexposed cells and was determined with a CellTiter 96 AQueous One Solution Cell Proliferation Assay (n.s., not significant; two-tailed unpaired Student’s t test). The bars represent the mean ± standard deviation (n = 6). Bottom: quantitative determination of GM-CSF expression by B16-F10 cells after infection with AAV2-GM-CSF. The bars represent the mean ± standard deviation (n = 4).

