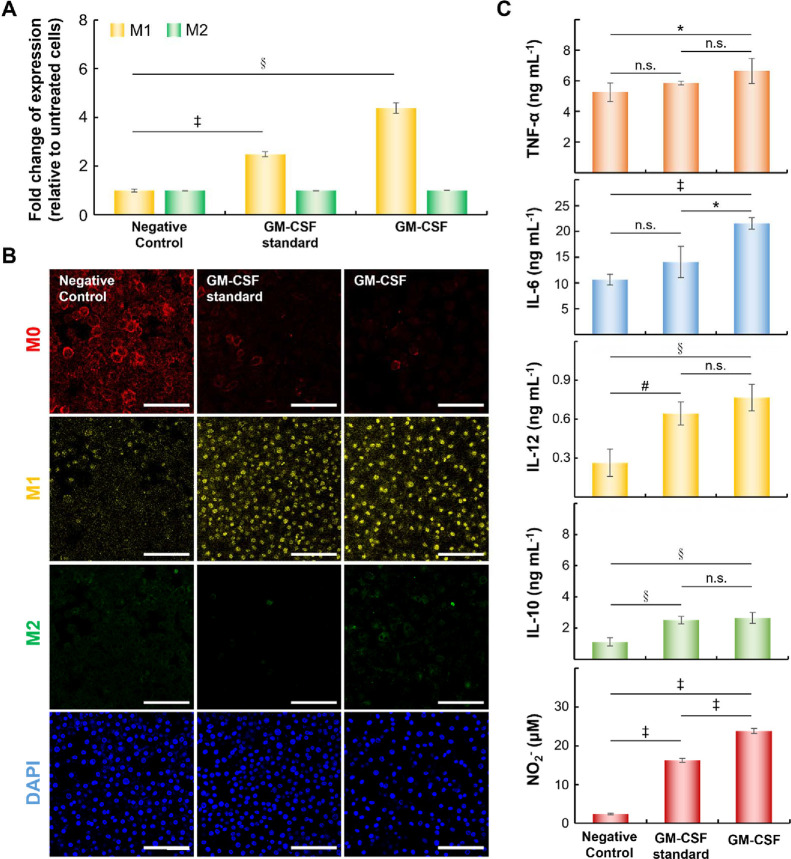
Figure 2.
Effects of GM-CSF produced by cancer cells on macrophages. (A) The expression of surface markers on M1 or M2 macrophages based on fold changes relative to that on untreated macrophages (§p < 0.0005, ‡p < 0.00005; two-tailed unpaired Student’s t test). Surface biomarkers such as MHC II and CD206 were used to identify M1 and M2 macrophages, respectively. The bars represent the mean ± standard deviation (n = 4). (B) Representative confocal images of macrophages treated under various conditions for 6 days. Scale bar = 100 μm. (C) Quantitative determination of cytokines (TNF-α, IL-6, IL-10, or IL-12) and NO2– concentrations using Cytokine Expression ELISA and Nitrite Assay Kits (*p < 0.05, #p < 0.005; §p < 0.0005, ‡p < 0.00005; n.s., not significant; two-tailed unpaired Student’s t test). The bars represent the mean ± standard deviation (n = 4).

