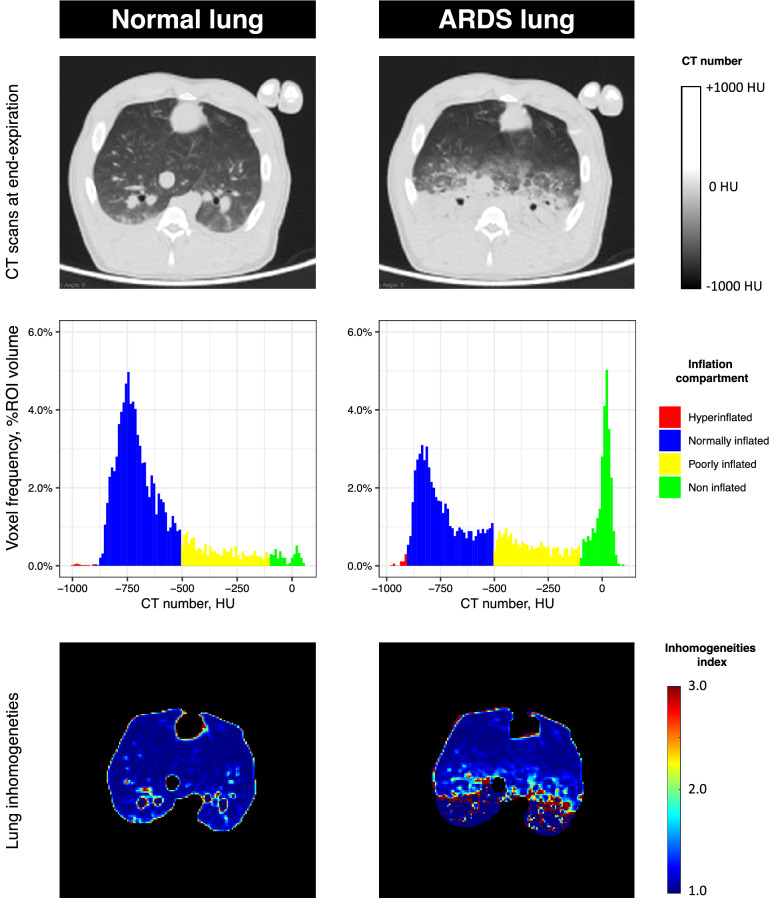
Fig. 2.
Representative lung CTs before and after ARDS induction in swine. The upper part of the figure shows 2 CT slice at mid-chest level in the same animal under mechanical ventilation, general anesthesia and neuromuscular blockade. CTs are acquired at end-expiration, before and after experimental ARDS is induced by intratracheal instillation of hydrochloric acid. The CT image on the right shows typical ARDS CT findings, with dependent alveolar consolidation and ground-glass opacities in the mid-level section. The medial part of the figure shows the distribution of CT numbers of the CT slices presented above, after the exclusion of extra-pulmonary areas by manual segmentation. To better represent the change in inflation, CT numbers were classified based on 4 inflation compartments: non-inflated (CT number between − 100 and 100 HU), poorly inflated (CT number between − 500 and − 101 HU), normally inflated (CT number between − 900 and − 501 HU) and hyperinflated (CT number below − 900 HU). The histograms clearly demonstrated how the non-aerated compartment increases, and the normally inflated compartment is diminished as a consequence of experimental ARDS. Finally, the lower part of the figure shows the parametric images of inhomogeneities based on the patented method by Cressoni and colleagues in the same CT slices (patent WO 2013/088336A1 “Method for determining inhomogeneity in animal tissue and equipment to implement it”). The image on the right shows how ARDS increases lung inhomogeneities, especially in zones at the interface of regions with different aeration (voxels in red). ARDS acute respiratory distress syndrome, CT computed tomography, HU Hounsfield unit

