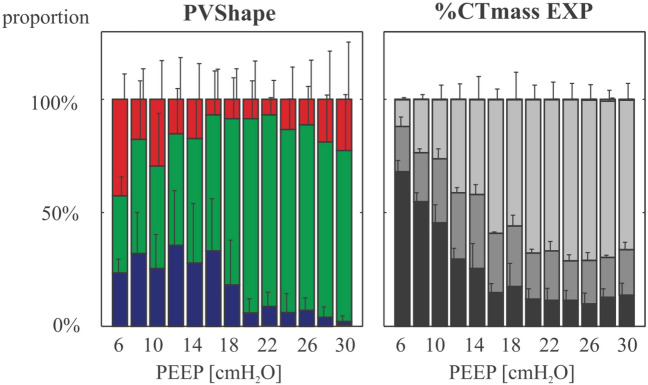
Fig. 3.
Inflation response to PEEP evaluated in lung EIT and quantitative CT in patients with ARDS. The figure shows the average proportion of the 3 inflation compartments derived from the innovative methods proposed by Beda and colleagues in which EIT ∆Z, as a surrogate of volume, is used to compute a pressure-volume response curve at each PEEP level of a decremental PEEP ramp. Red bars are the proportion of voxels estimated to be exposed to tidal hyperinflation, blue bars those that undergo tidal collapse, and green bars voxels in which the change in the P-V curve is linear and ventilation is considered homogenous. These EIT-derived parameters are compared to CT-derived inflation compartments at end-expiration and at the same PEEP levels (on the right side). Inflation compartments in CT are defined as follows: non-aerated (− 100 to 100 HU, black bars), poorly aerated (-500 to -101 HU, dark grey bars), normally aerated (− 900 to 501 HU, light grey bars), and hyperaerated (− 1000 to − 901 HU, white bars). The authors conclude that there was a significant correlation between the EIT-computed overdistension parameter and non-inflated volumes at low PEEP levels, and with hyperinflated volumes at high PEEP levels, although the strength of correlation were weak. CT computed tomography, EIT electrical impedance tomography, PEEP positive end-expiratory pressure. Reproduced with permission from Wolters Kluwer Health [42]

