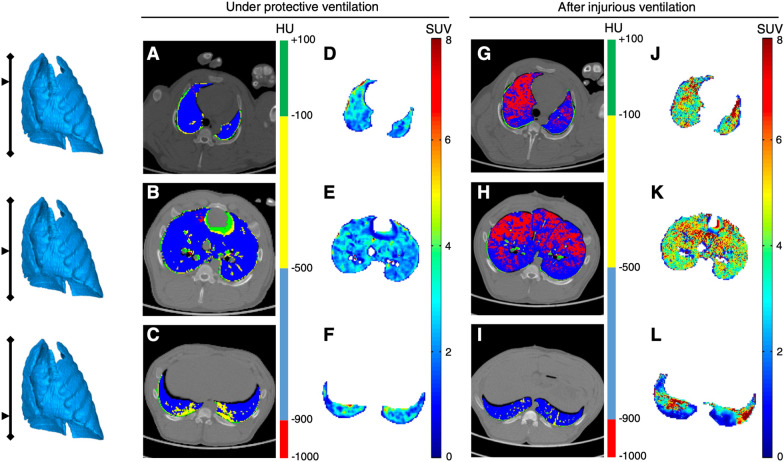
Fig. 6.
Acute lung macrophage inflammation in response to high tidal volume ventilation. The figure shows the coupled PET-CT acquisitions in 3 lung slices acquired in the same animal, before and after 4 h of high tidal ventilation (targeting a transpulmonary pressure between 35 and 40 cmH2O). PET was performed using [11C](R)-PK11195, a TSPO-specific PET radiotracer that allow the non-invasive quantification of lung macrophages. CT acquisitions are performed at end-inspiration and are shown as parametric images in which the voxel’s CT number is expressed based on the 4 inflation compartments (see color scale). The figure shows how the radiotracer’s lung uptake (in SUV) is increased in all lung regions after injurious ventilation; this is especially true in ventral lung areas, where hyperinflation is distributed (red voxels on the end-inspiratory CT slices). CT computed tomography, HU Hounsfield unit, PET positron emission tomography, SUV standardized uptake value

