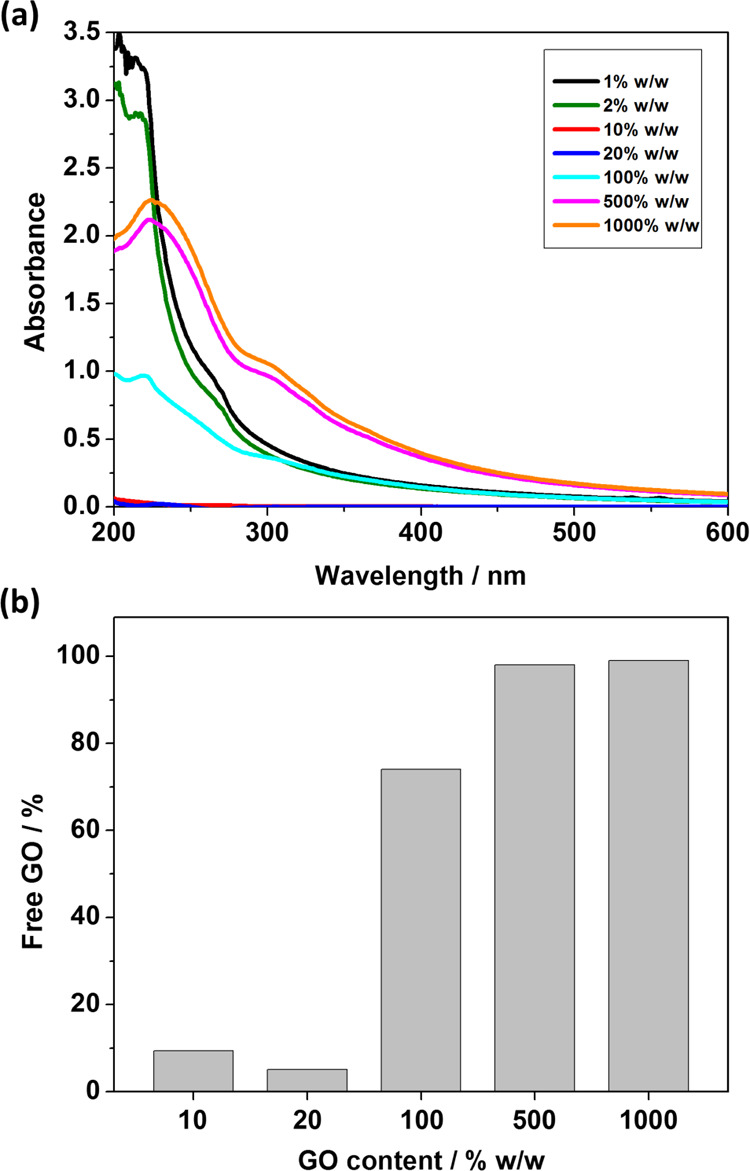
Figure 7.

(a) UV–vis spectra for diluted supernatants obtained from centrifuged heteroflocculation samples prepared using V32–B300 latexes with varying GO contents at pH 5 (entries 8–14, Table S3). (b) Calculated mass fraction of free GO for corresponding heteroflocculation samples.
