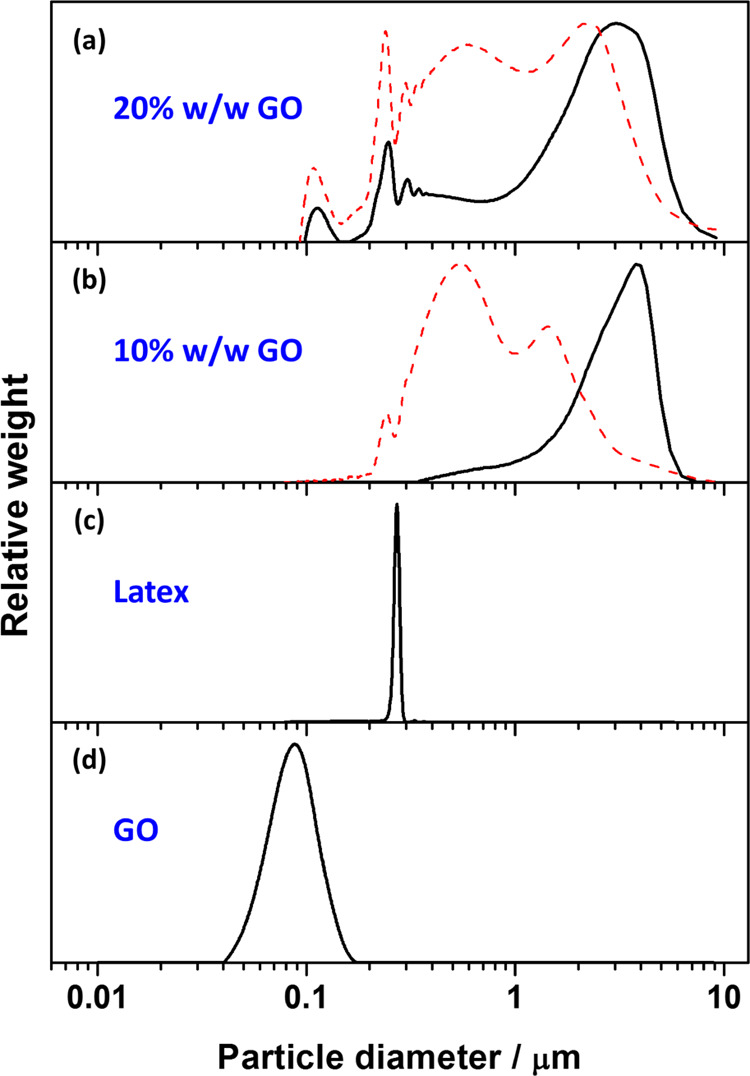
Figure 8.

DCP particle size distributions obtained before (solid line) and after (dashed line) sonication for PEGVP/GO nanocomposite particles prepared at pH 5 with GO contents of (a) 20% w/w (entry 11, Table S2) and (b) 10% w/w (entry 10, Table S2), (c) PEGVP latex (entry 4, Table 1), and (d) GO nanosheets obtained via sonication at 70% amplitude for 30 min in aqueous solution at pH 5. For ease of comparison, the density used for all DCP analyses was fixed as 1.11 g cm–3.
