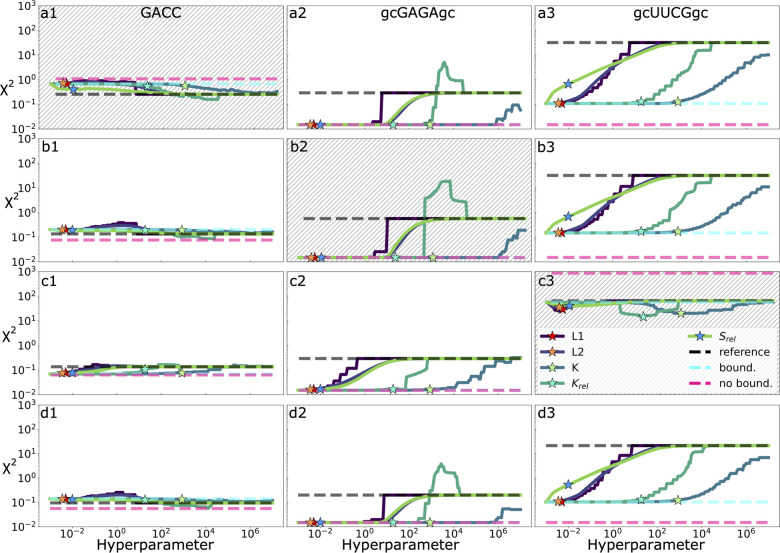
Figure 6.
Results of the cross-validation tests on multiple systems using all of the tested regularization methods. In rows a–c the error function is evaluated on the training (white background) and validation (hatched) systems using parameters obtained minimizing the error and a scan over a wide range of values for the regularization hyperparameter. Columns 1–3 correspond to the error contribution for systems GACC, gcGAGAgc, and gcUUCGgc. Stars mark the optimal hyperparameter for the respective regularization penalty determined by cross-validation on observables (compare Figure 4). Error functions for the reference force field (gHBfix19), for an unregularized minimization without boundaries, and for an unregularized minimization with boundaries at ±1 kcal/mol relative to the original force field are reported as horizontal dashed lines. Parameters associated with each minimization obtained both with and without regularization can be found in SI Tables 3–6. Row d shows the results for the training error using all available experimental and simulation data during the fitting.

