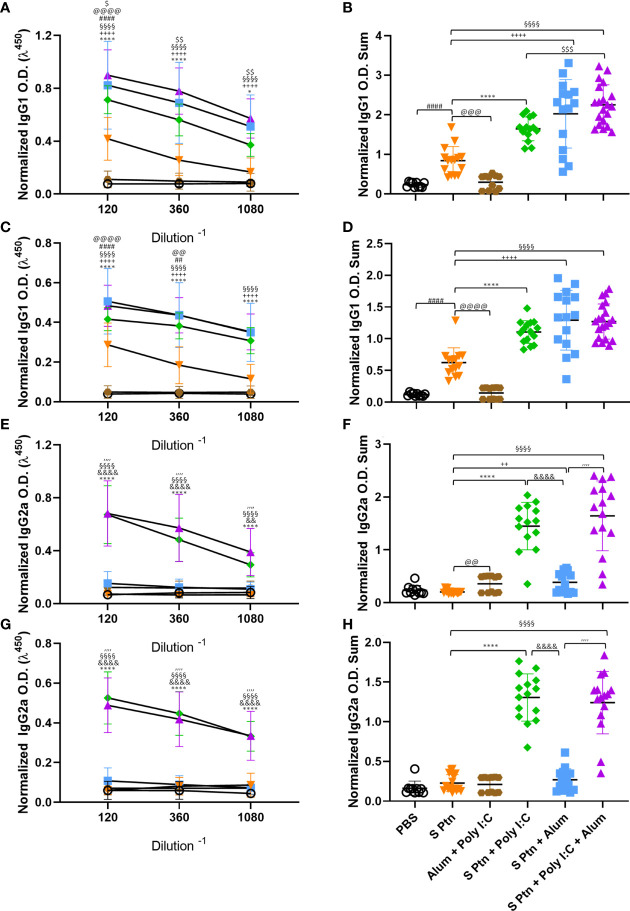
Figure 3.
Formulations containing Poly(I:C) were able to induce type 1 response serum antibodies. Antigen-specific antibody levels were determined by ELISA and normalized using the control groups. Serum IgG1 (A–D) and IgG2a (E–H) levels were evaluated after two (A, B, E, F) or three immunizations (C, D, G, H). The summatory of all dilutions are represented in (B, D, F, H). Data in this figure consists 4 independent experiments normalized using the control groups and shown as mean ± S.D. Groups: PBS (n=10); S Ptn (n=15); Alum + Poly(I:C) (n=11); S Ptn + Poly(I:C) (n=15); S Ptn + Alum (n=15); S Ptn + Poly(I:C) + Alum (n=20). # - represents differences between PBS and S Ptn groups; @ - represents differences between S Ptn and Alum + Poly(I:C) groups; * - represents differences between S Ptn and S Ptn + Poly(I:C) groups; + - represents differences between S Ptn and S Ptn + Alum groups; § - represents differences between S Ptn and S Ptn + Poly(I:C) + Alum groups; $ - represents differences between S Ptn + Poly(I:C) and S Ptn + Poly(I:C) + Alum groups; & - represents differences between S Ptn + Poly(I:C) and S Ptn + Alum groups; ‘ - represents differences between S Ptn + Alum and S Ptn + Poly(I:C) + Alum groups. (A, C, E, G) was performed two-way ANOVA followed by Bonferroni post-test and (B, D, F, H) was analyzed by one-way ANOVA with Tukey’s post hoc test. *p<0.05, ****p<0.0001.

