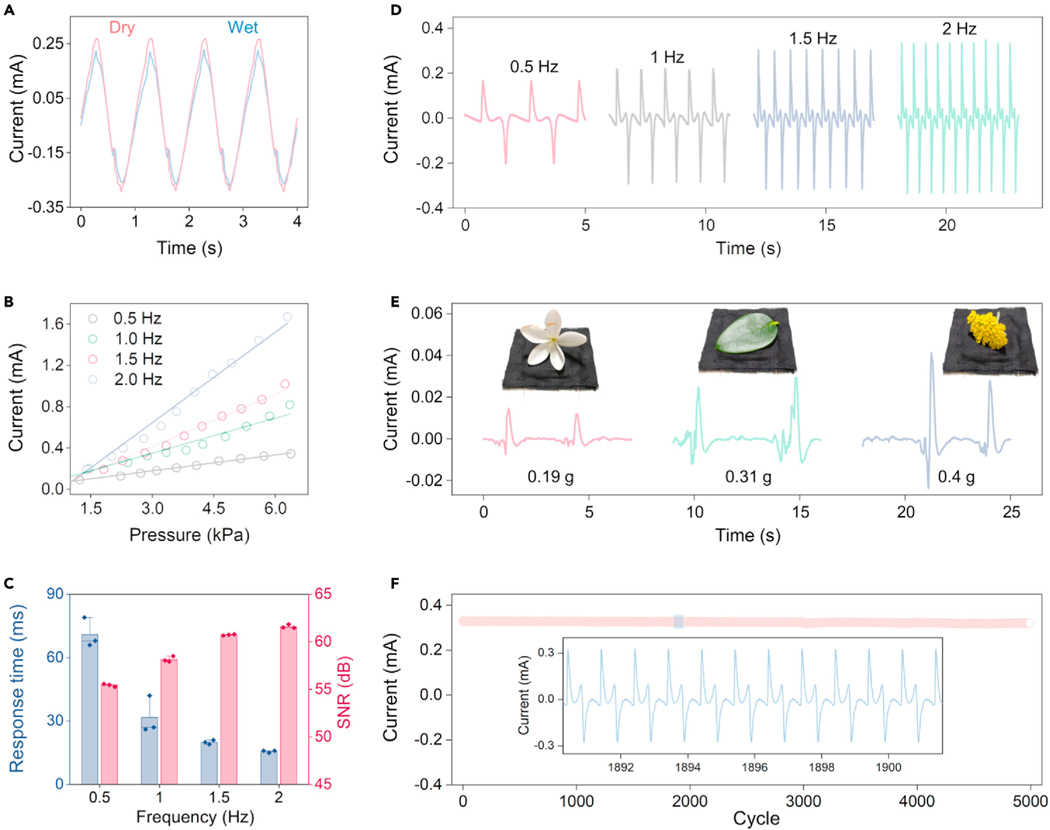
Figure 4. Standard evaluation of textile MEGs for self-powered sensing.
(A) Comparison of the sensing signals obtained from the textile MEG under wet and dry conditions.
(B) Sensing signal dependence on the applied pressure frequency and amplitude.
(C) Dependence of the response time and signal-to-noise ratio of the textile MEGs on the applied pressure frequency. Error bars are standard deviations of the results from three samples.
(D) Waveforms of the sensing signals under different applied pressure frequencies.
(E) A tiny white flower, a green leaf, and a yellow flower were gently dropped onto the textile MEG and generated distinct current signals.
(F) Cyclic test of the textile MEGs for more than 5,000 cycles, and an enlarged view of the marked region, showing excellent stability and repeatability.

