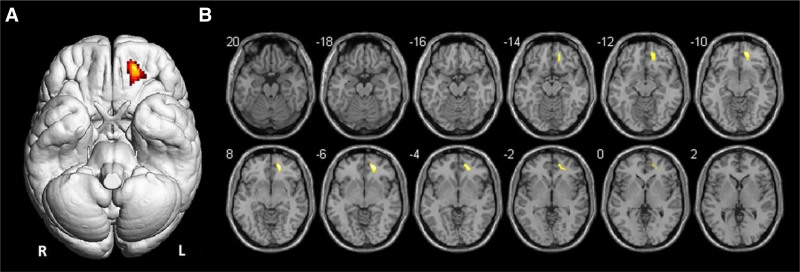
FIGURE 2.
Surface render (A) and axial Magnetic Resonance (MR) slices (B) showing SPM analysis results. The colored areas indicate the locations where the voxel values of the patients are significantly hypometabolic compared to the healthy control group (P < 0.001). The t-value is represented by the brightness of the color.

