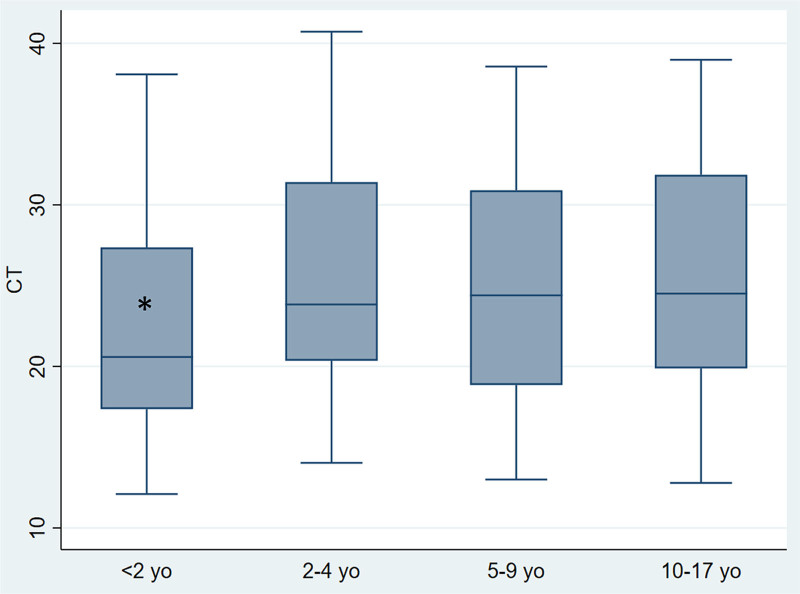
FIGURE 2.
Comparison of Ct values by age (under 2 years, 2–4 years, 5–9 years and 10 years or older). *Ct values were significantly lower (P < 0.001) in children under 2 years of age (Ct: 20.6; RIC: 17.3–27.3) than in older children. Median is represented as a solid line, interquartile ranges are represented by boxes, upper and lower adjacent values are represented by whiskers and outliers are represented by isolated points. yo. years old.

