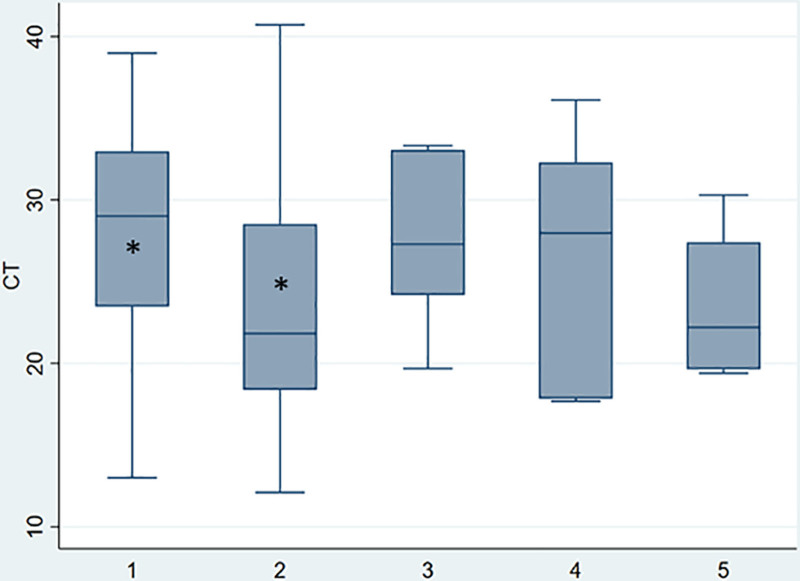
FIGURE 4.
Comparison of Ct values according to severity of symptoms. *P < 0.001. Median is represented as a solid line, interquartile ranges are depicted by boxes, upper and lower adjacent values are represented by whiskers and outliers are represented by isolated points. (1) asymptomatic, (2) mild, (3) moderate, (4) severe, (5) critical.

