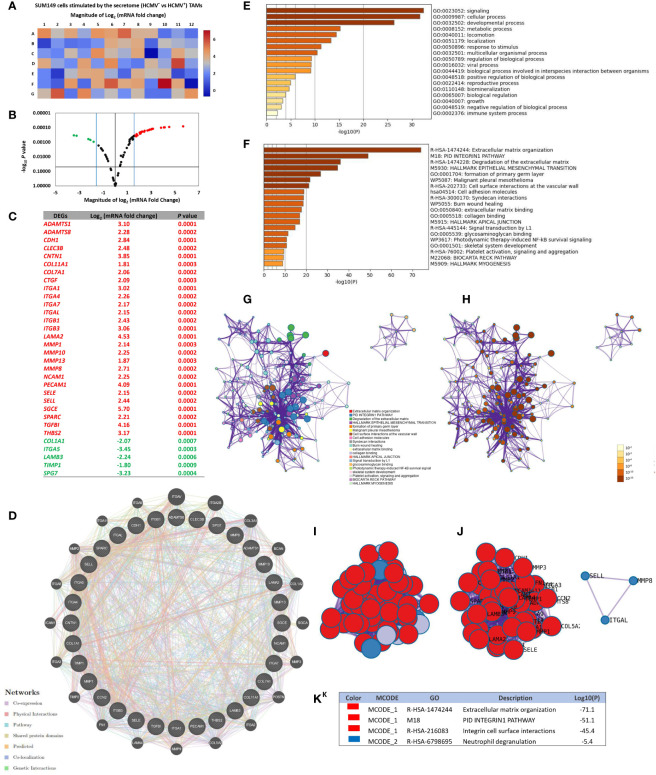
Figure 4.
Up- and downregulated extracellular matrix and cell adhesion genes of SUM149 cells stimulated by the secretome of HCMV+ polarized TAMs versus HCMV+ polarized TAMs. (A, B) Heat map and volcano plot showing significant up- and downregulated genes in SUM149 cells stimulated by the secretome of HCMV+ polarized TAMs compared to HCMV+ polarized TAMs. (C) Table showing the Log2 mRNA fold change and significant P values of up- and downregulated genes in SUM149 cells stimulated by the secretome of HCMV+ polarized TAMs versus HCMV+ polarized TAMs. (D) Gene-gene interaction network of different expressed extracellular matrix and cell adhesion molecule genes and their neighboring genes. Each node represents a gene, and the size of which represents the strength of the interaction. (E) Bar graph of the top-level Gene Ontology biological processes, with P-values. (F) Bar graph of enriched terms across input gene lists, with P -values. (G, H) Network of enriched terms: colored by cluster ID, where nodes that share the same cluster ID are typically close to each other; colored by p-value, where terms containing more genes tend to have a more significant P-value. (I, J) Protein-protein interaction network and MCODE components identified in the gene list. (K) Table showed the functional analysis of MCODE1 and MCODE2 components.

