Figure 6.

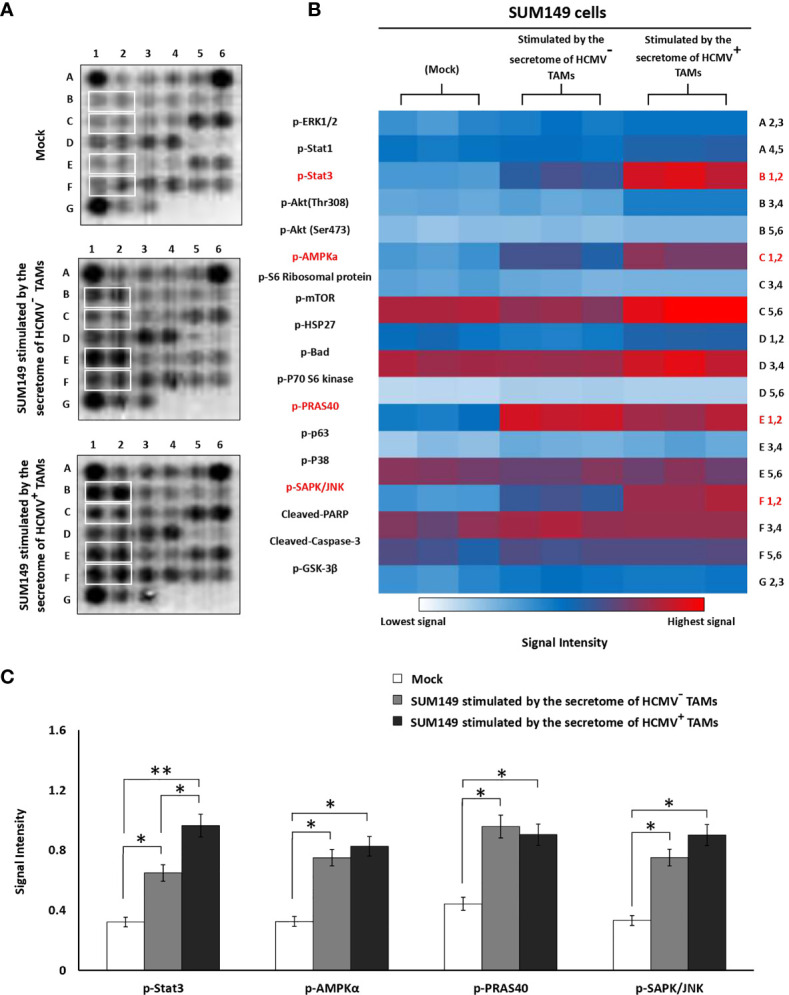
Intracellular pathways array analysis of SUM149 cells stimulated by the secretome of HCMV- and HCMV+ TAMs compared to mock cells. (A) PathScan® intracellular array membranes of SUM149 cells stimulated by the secretome of HCMV- and HCMV+ TAMs compared to mock cells. (B) Heat map showing the different activation levels of eighteen signaling molecules in SUM149 cells stimulated by the secretome of HCMV- and HCMV+ TAMs compared to mock cells. (C) Bars represent a high expression of p-STAT3, p-AMPKa, p-PRAS40, and p-SAPK/JNK intracellular cell signaling molecules in SUM149 cells stimulated by the secretome of HCMV- and HCMV+ TAMs compared to mock cells. * Represented (P < 0.05) and ** represented (P < 0.01) as determined by one-way ANOVA test followed by Tukey’s HSD and Post Hoc tests. Data represented as means ± SD (number of experimental replicates = 3).
