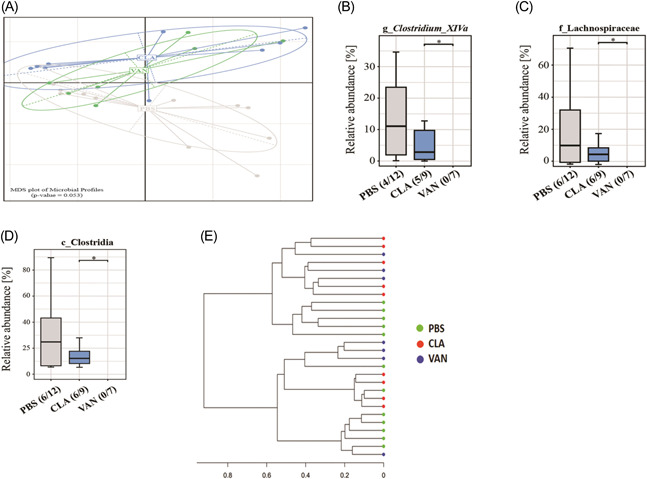
Figure 2.

Analysis of lung microbiota. (A) Unconstrained nMDS plot of generalized UniFrac distances; (B–D) impact of antibiotics on some specific lung bacterial taxa. (E) 16S dendrogram (Ward's clustering method) based on generalized UNiFrac distances. PBS (n = 12), CLA (n = 9), and VAN (n = 7). Numbers in brackets below the graphs show the number of samples within which a certain taxon was detected (e.g., PBS [4/12] means the taxon was detected in 4 samples out of 12). *p < .05 indicates significant differences. CLA, clarithromycin; nMDS, nonmetric multidimensional scaling; PBS, phosphate‐buffered saline; VAN, vancomycin.
