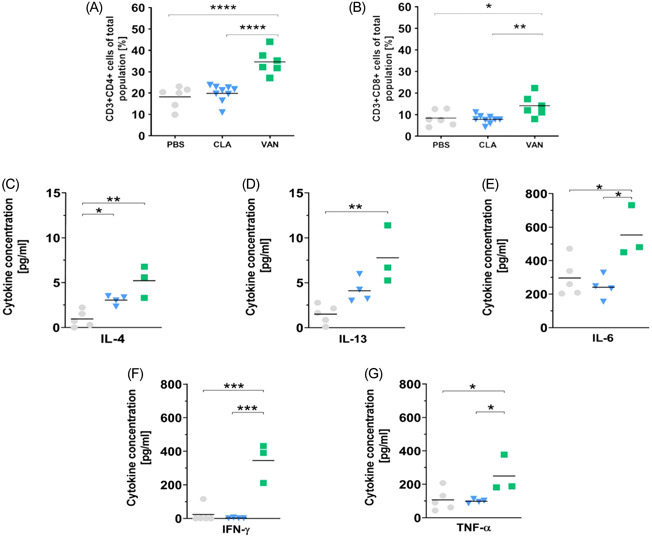
Figure 3.

(A, B) T cell population in the lungs. n for PBS, CLA, and VAN are 6, 9, and 6, respectively. (C–G) cytokines in the supernatant of CD3/CD28 stimulated cell cultures of lung cells (The scales differ according to the variable abundance of the cytokines). n = 5 (PBS), n = 4 (CLA), n = 3 (VAN), and each n represents pooled samples. *p < .05, **p < .01, ***p < .001, and ****p < .0001 represent significant differences. CLA, clarithromycin; PBS, phosphate‐buffered saline; VAN, vancomycin.
