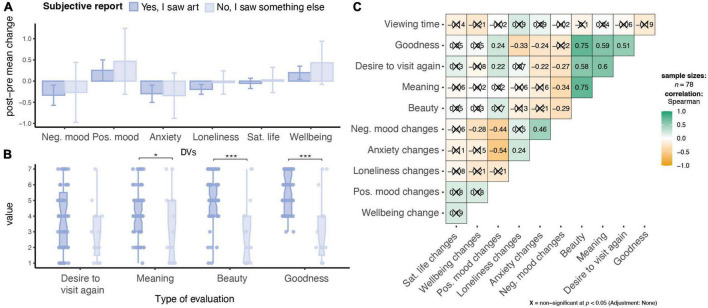
FIGURE 4.
Subjective experience of participants, including (A) DV changes grouped by perception of if participants considered they say art or not, bar plots showing the breakdown of changes in Wellbeing DVs. Error bars represent 95% CI. (B) Box plots showing the breakdown of the aesthetic ratings grouped by subjective reports (i.e., seeing art), Error bars represent SD. *p < 0.05, ***p < 0.001. p-values uncorrected. (B) Appraisals shown broken down by I saw art or not. (C) Correlations between viewing time, appraisals and changes in Wellbeing DVs. Correlation plot was computed using ggstatplot (Patil, 2021).

