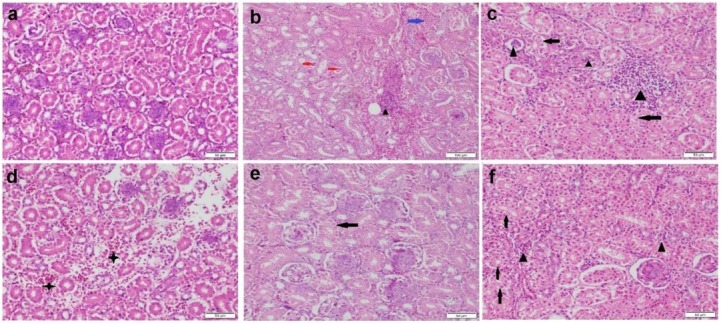
Fig. 5.

Photomicrograph of kidney tissue sections stained by haematoxylin and eosin. a – control group with normal histological structure; b–d – ochratoxin A (OTA) group showing vacuolar degeneration (black arrows), necrosis (blue arrow) and desquamation (red arrows) of tubular epithelium, tubular and interstitial inflammatory cell infiltration (black triangles) and interstitial haemorrhage (black stars); e–f – Bacillus subtilis fermentation extract + OTA group showing moderate vacuolar degeneration (black arrows) in some tubular epithelial cells and mild interstitial inflammatory cell infiltration (black triangles)
