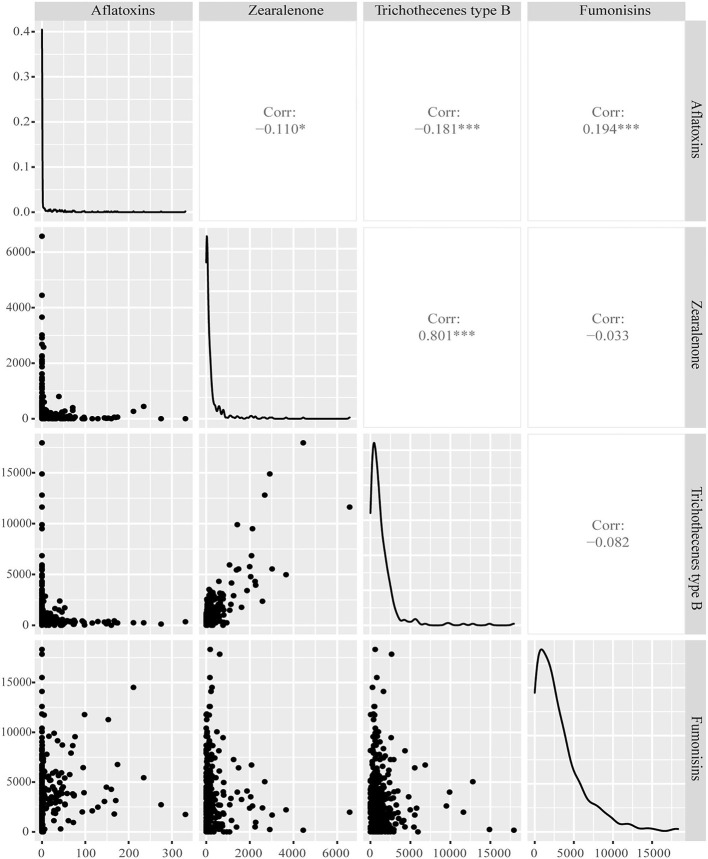
Figure 3.
Correlation of mycotoxin concentrations of new season maize in China in 2021. Panels on the lower left side show the distribution of concentrations (in μg/kg) for each combination of two mycotoxins. Panels in the diagonal show the distribution of concentrations for each mycotoxin. Panels on the upper right side show the correlation coefficient for each combination of two mycotoxins. ***P < 0.001; **P < 0.01; *P < 0.05.

