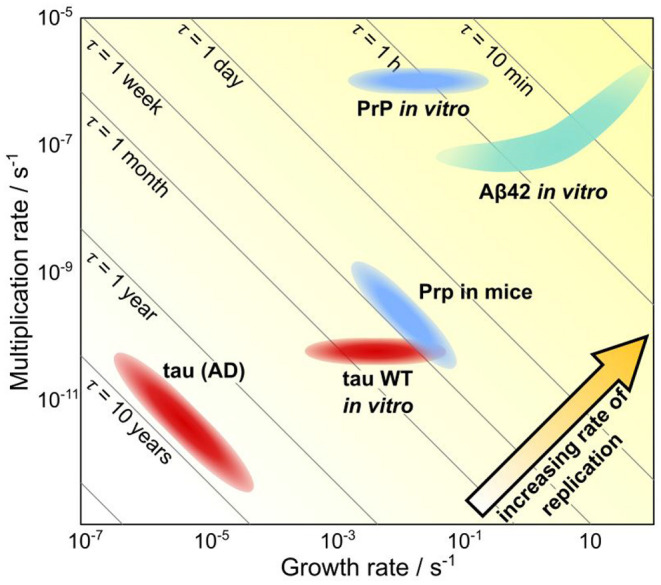
Figure 6.

Quantification of timescales of aggregation across systems. A plot showing the growth rate versus the multiplication rate, for a number of proteins, using either rates determined in vivo or rates determined in vitro and extrapolated to in vivo concentrations. Along the diagonal lines, the doubling time is unchanged, thus going from the bottom left hand to the top right hand corner the rate of replication increases. Notably, the same proteins tend to aggregate orders of magnitude slower in vivo than they do in vitro, highlighting the ability of living systems to prevent aggregation. Adapted from Meisl et al. (2021a).
