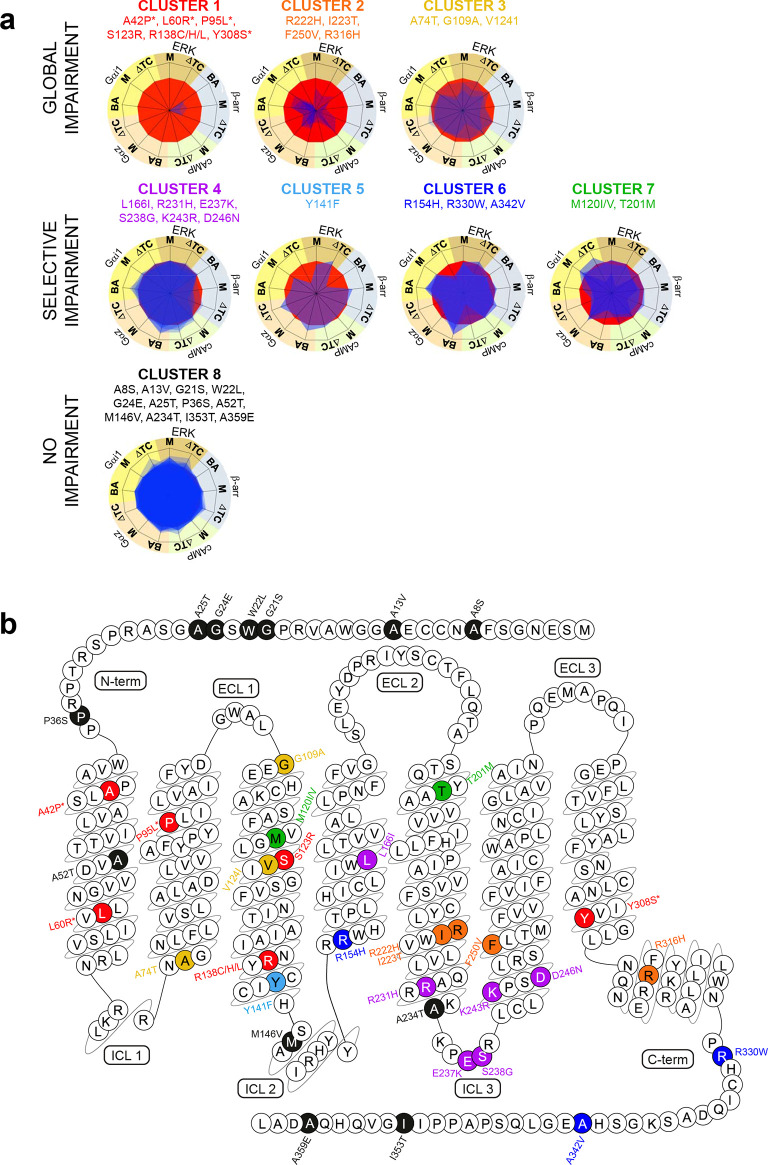
Figure 2.
Eight phenotypes of MT2 variants and their localization in the receptor sequence. (a) Superimposition of signaling signatures sharing the same cluster for the eight clusters. Basal activities (BA), agonist-mediated maximal efficacies (M), and Δlog(τ/KA) ratios (ΔTC)51 were expressed as normalized differences from WT MT2. (b) Localization of the 40 MT2 variants color-coded according to their respective cluster (CL): red (CL1; severe global signaling impairment), orange (CL2; moderate global signaling impairment), yellow (CL3; slight global signaling impairment), purple (CL4; selective impairment of agonist-mediated βarr2 recruitment), light blue (CL5; selective impairment of Gαi1 activation and basal βarr2 recruitment), dark blue (CL6; Gαi1 activation selective impairment), green (CL7; Gαz activation selective impairment), and black (CL8; no signaling impairment). * indicates the four variants that lose the ability of binding melatonin. The snake plot was created using the tools at www.gpcrdb.org.

