Figure 3.
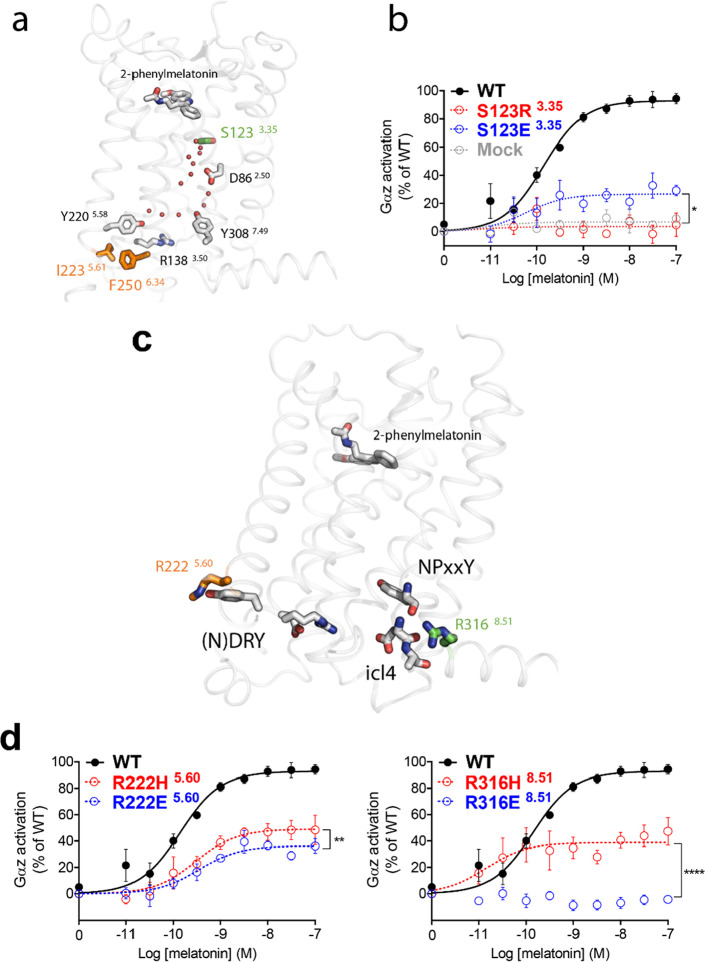
Disruption of key MT2 activation switches by genetic variants characterized by a global signaling impairment. (a) Side view of the crystal structure of the agonist-bound human MT2 in the inactive state showing the location of conserved residues of the water-mediated polar network—depicted by red dots. S1233.35 (green) is in the vicinity of D862.50, while I2235.61 and F2506.34 (orange) are packed against each other below Y2205.58 and nearby the key functional residues R1383.50 of the DRY motif and Y3087.49 of the NPxxY motif. (b) Melatonin dose–response curves of Gαz activation by WT MT2 (black curve), MT2-S123R3.35 (dotted red curve), MT2-S123E3.35 (dotted blue curve), or in the absence of transfected receptor (Mock; dotted gray curve). (c) Side view of the crystal structure of MT2 showing R2225.60 (orange) and R3168.51 (green) facing the nearby DRY and NPxxY motifs and ICL4. (d) Melatonin dose–response curves of Gαz activation by WT MT2 (black curve), MT2-R222H5.60 or MT2-R316H8.51 (red dotted curve), and MT2-R222E5.60 or MT2-R316E8.51 (blue dotted curve). Each point represents the mean ± SEM of five independent experiments performed in quadruplicate (distinct samples). The statistical differences between melatonin-induced maximal responses (Emax) were assessed by comparing the best-fit values of top (Emax) (*p = 0.0109, **p = 0.0038, and ****p < 0.0001).

