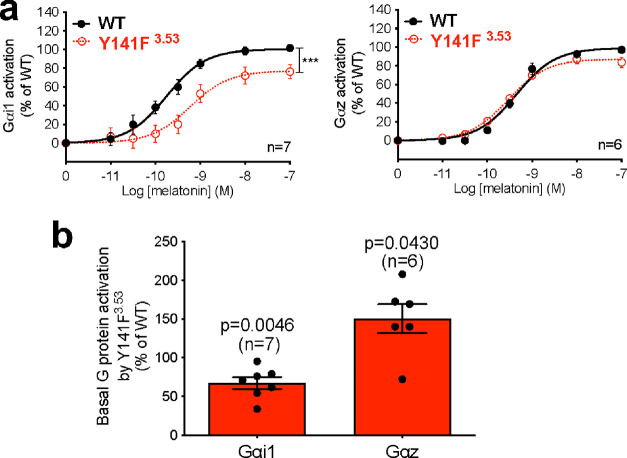
Figure 5.
Biased signaling for Gαi1 and Gαz activation by MT2-Y141F3.53. (a) Melatonin dose–response curve of Gαi1 (left panel) and Gαz (right panel) by WT MT2 and MT2-Y141F3.53. (b) Basal Gαi1 and Gαz activation by MT2-Y1413.53 relative to WT. Statistical differences between melatonin-induced maximal responses (Emax) were assessed by comparing the best-fit values of top (Emax) (***p = 0.0006) in (a), while significance compared to WT MT2 was assessed by a one-sample t-test and compared to 100 in (b). Each point represents the mean ± SEM of independent experiments performed in quadruplicate (distinct samples). n denotes the number of experiments performed.

