Figure 6.
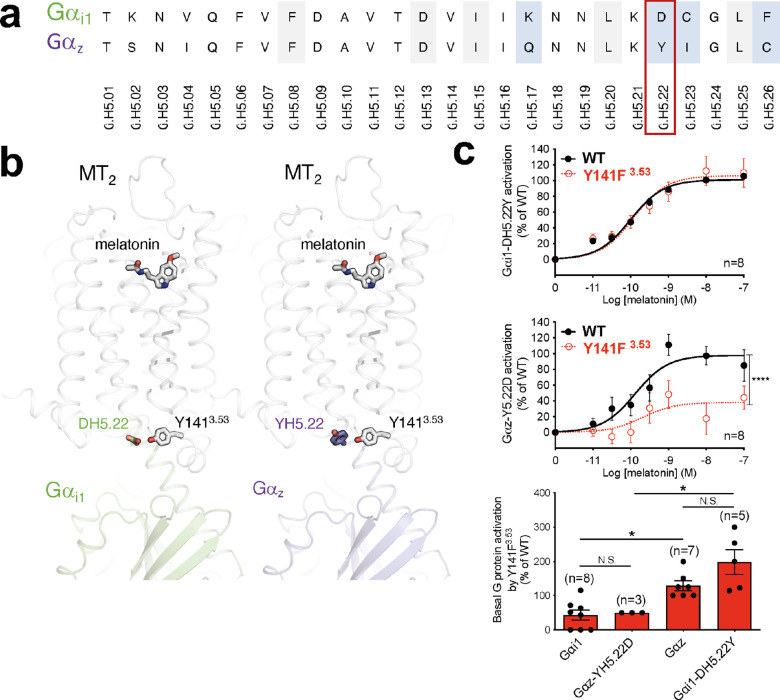
Potential role of residue H5.22 in the differential activation of Gαi1 and Gαz by MT2-Y141F3.53. (a) Alignment of Gαi1 and Gαz H5 region. Residues are identified according to the common Gα numbering system.52 Residues conserved in all Gα protein subtypes are highlighted in gray, and residues different in Gαi1 and Gαz are highlighted in blue. (b) Side view of human MT2/Gαi1 (green) and MT2/Gαz (purple) complexes showing the residue at position H5.22 (D in Gαi1 and Y in Gαz) interacting with Y1413.53 of MT2 through a hydrogen bond (for D in Gαi1) or through aromatic interactions (for Y in Gαz). (c) Melatonin dose–response curve of Gαi1-DH5.22Y (upper panel) and Gαz-Y5.22D (middle panel) by WT MT2 and the Y1413.53 variant. Basal activation of WT or mutant Gαi1 and Gαz by Y1413.53 (bottom panel). Statistical differences between melatonin-induced maximal responses (Emax) were assessed by comparing the best-fit values of top (Emax) (****p < 0.0001), while a one-way ANOVA, followed by Tukey’s multiple comparisons test, was used to compare the basal WT of mutant Gαi1 and Gαz activation by MT2-Y141F3.53 (*p < 0.05). Each point represents the mean ± SEM of independent experiments performed in quadruplicate (distinct samples). n denotes the number of experiments performed, and N.S. stands for non-significant.

