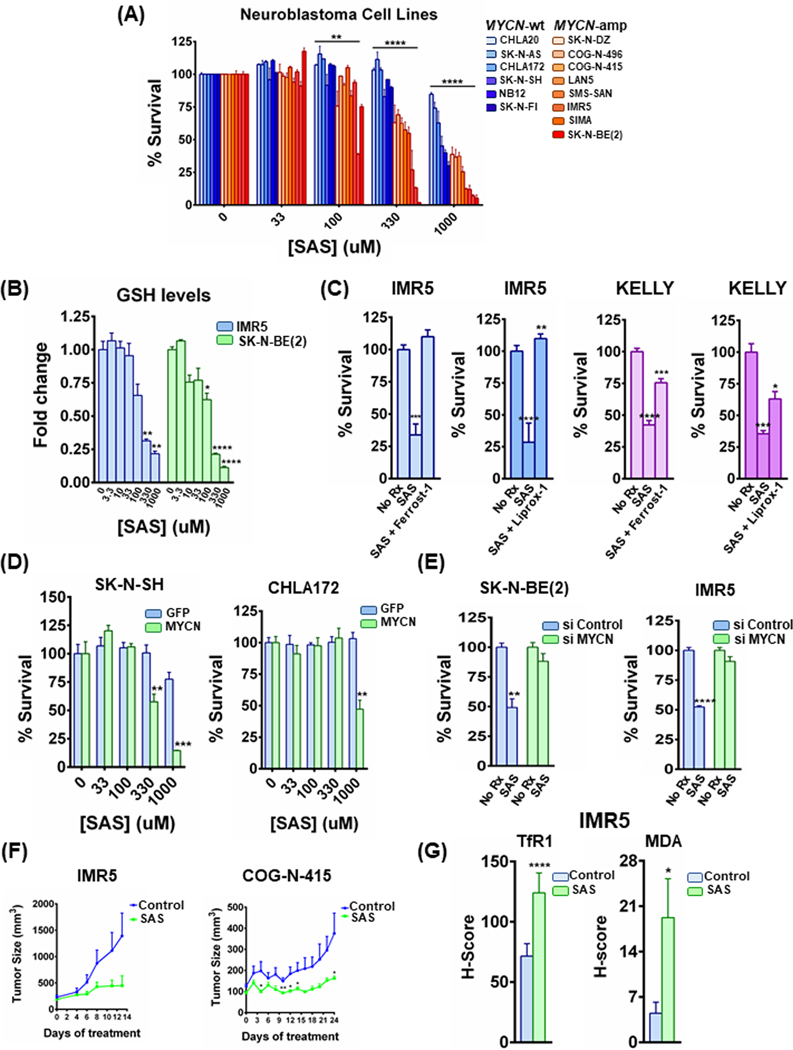
Figure 3. The system xc- inhibitor sulfasalazine induces ferroptosis specifically in MYCN-amplified neuroblastoma cells in vitro and promotes tumor responses in vivo.
(A) MYCN-amplified and MYCN-wild type cell lines, were treated with increasing concentrations of sulfasalazine (SAS) for 72h and cell viability was detected by CellTiter-Glo, n=3, error bars indicate +SD. Two-way Anova test was performed for each concentration separately to determine the effect of the different cell lines as well as the effect of the MYCN status for each concentration. p-values were corrected for multiple testing using Bonferroni method. Differences were considered statistically different if p < 0.05, * p < 0.05, ** p < 0.01, *** p < 0.001, **** p < 0.0001. (B) IMR5 and SK-N-BE(2) MYCN-amplified cells were treated with increasing concentrations of SAS for 48h and GSH levels were measured by GSH-Glo assay kit from Promega. Data are means ± SEM with n=3 biological replicates. (C) KELLY and IMR5 MYCN-amplified NB cells were treated with 1mM of SAS or 1mM of SAS together with 10μM of ferrostatin-1 and 10 μM of liproxstatin-1 for 24h (KELLY) and 48h (IMR5) and cell viability was detected, n=3, error bars indicate +SD. (D) Syngeneic SK-N-SH and CHLA172 cells were treated with increasing concentrations of sulfasalazine (SAS) for 48h and cell viability was measured by CellTiter-Glo assay, n=3, error bars indicate +SD. (E) MYCN-amplified cell lines treated with 1 mM of SAS for 48h after being transfected with siRNA against MYCN or non-targeting siRNA. Cell viability was assessed as before, n=3 biological replicates, error bars indicate +SD. Lysates from the same cells were used also for Sup. Fig. 2D. (F) MYCN-amplified NB cell line xenograft (IMR5) as well as PDX model (COG-N-415), were randomized into treatment cohorts as described in the Material and Methods section. Sulfasalazine was administered intraperitoneally, at a dosage of 250 mg/kg, six days a week (Monday-Saturday). Tumor measurements were performed every other day by calipers, and the average tumor volume + SEM for each cohort is displayed. (G) The ferroptosis markers transferrin receptor 1 (TfR1) and malondialdehyde (MDA) in control and sulfasalazine treated IMR5 xenografts were detected by immunohistochemistry and their staining was quantified, error bars indicate +SEM. For figures 3B-3G, Student’s t test was performed, and p-values were corrected for multiple testing using Bonferroni method. Differences were considered statistically different if p < 0.05. For all calculated p-values: * p < 0.05, ** p < 0.01, *** p < 0.001, **** p < 0.0001.

