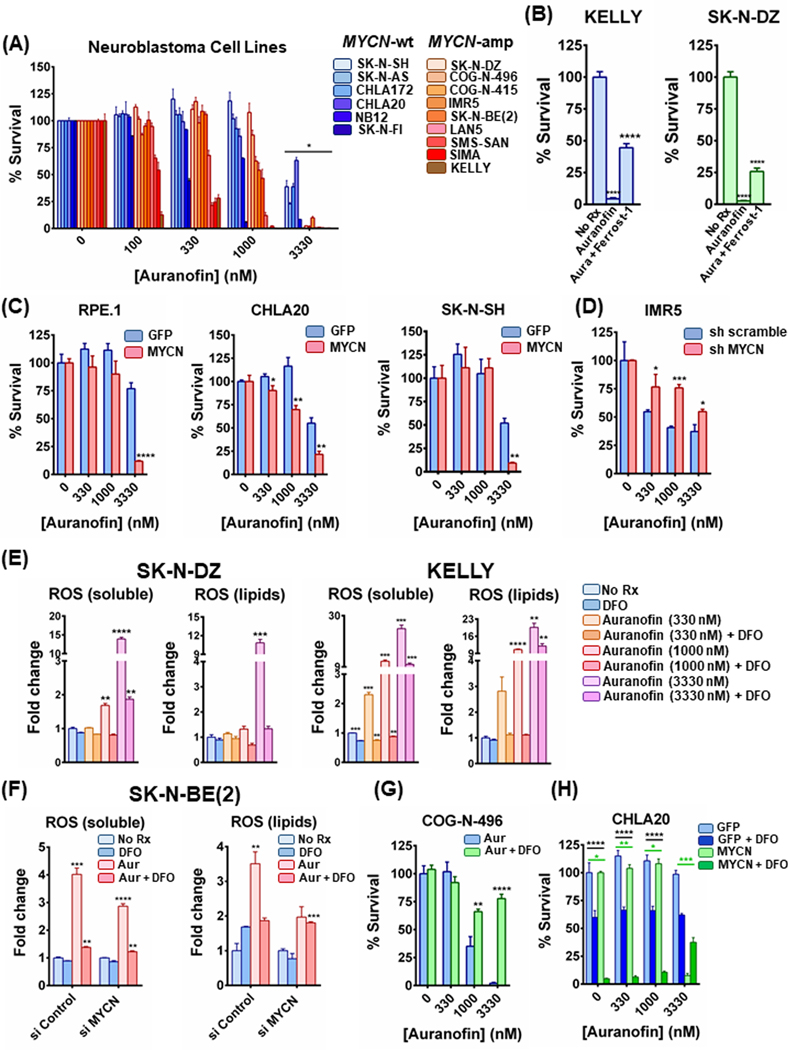
Figure 5. FDA-approved auranofin induces ferroptosis specifically in MYCN-amplified NB in vitro and promotes tumor responses in vivo.
(A) A panel of MYCN-amplified and a panel of MYCN-wild type NB cell lines were treated with increasing concentrations of auranofin for 72h and the percentage of viable cells was measured by CellTiter-Glo assay, n=3, error bars indicate +SD. Non-parametric Mann-Whitney test was performed for each concentration separately, comparing cell viability values between MYCN-wt and MYCN-amplified cell lines. Differences were considered statistically different if p < 0.05. (B) KELLY and SK-N-DZ MYCN-amplified NB cells were treated with 3300 nM of auranofin or 3300 nM of auranofin together with 10μM of ferrostatin-1 overnight and cell viability was detected, n=3, error bars indicate +SD. (C) RPE.1, CHLA20 and SK-N-SH syngeneic models expressing MYCN and GFP were treated with increasing concentrations of auranofin for 48h, 72h and 12h respectively and CellTiter-Glo assay was performed, n=3, error bars indicate +SD. (D) Additionally, IMR5 cells were transduced with lentiviruses containing plasmids with shRNA sequences targeting MYCN or a nontargeting control. Puromycin-resistant cells were pooled after each infection. Both sh MYCN and sh Scramble cells were also treated with increasing concentrations of auranofin for 12h and cell viability was assessed, n=3, error bars indicate +SD. (E) KELLY and SK-N-DZ cells were treated with increasing concentrations of auranofin with or without 100 μM DFO for 5h and stained with CM-H2DCFDA and C-11 BODIPY to mark general and lipid oxidative stress respectively, n=3, error bars indicate +SEM. (F) MYCN-amplified SK-N-BE(2) cells were treated with 50 nM scrambled or MYCN-targeting siRNA for 24 h. Cells were reseeded and treated the following day with 3300 nM auranofin alone or in the presence of 100 μM DFO for 3h and intracellular as well as lipid ROS levels were measured, n=3, error bars indicate +SEM. (G) and (H) Ex vivo MYCN-amplified PDX cells COG-N-496 as well as the syngeneic CHLA20 pair were treated with increasing concentrations of auranofin in combination with 100 μM DFO overnight (COG-N-496) or for 48h (CHLA20 MYCN/GFP) and the percentage of viable cells was detected by CellTiter-Glo, n=3, error bars indicate +SD. For figures 5B-5G, Student’s t test was performed, and p-values were corrected for multiple testing using Bonferroni method. For figure 5H, two-way Anova test was performed for each concentration separately; the comparisons between GFP and MYCN are depicted with green color and the comparisons between −/+ DFO with black color. Differences were considered statistically different if p < 0.05. For all calculated p-values: * p < 0.05, ** p < 0.01, *** p < 0.001, **** p < 0.0001.

