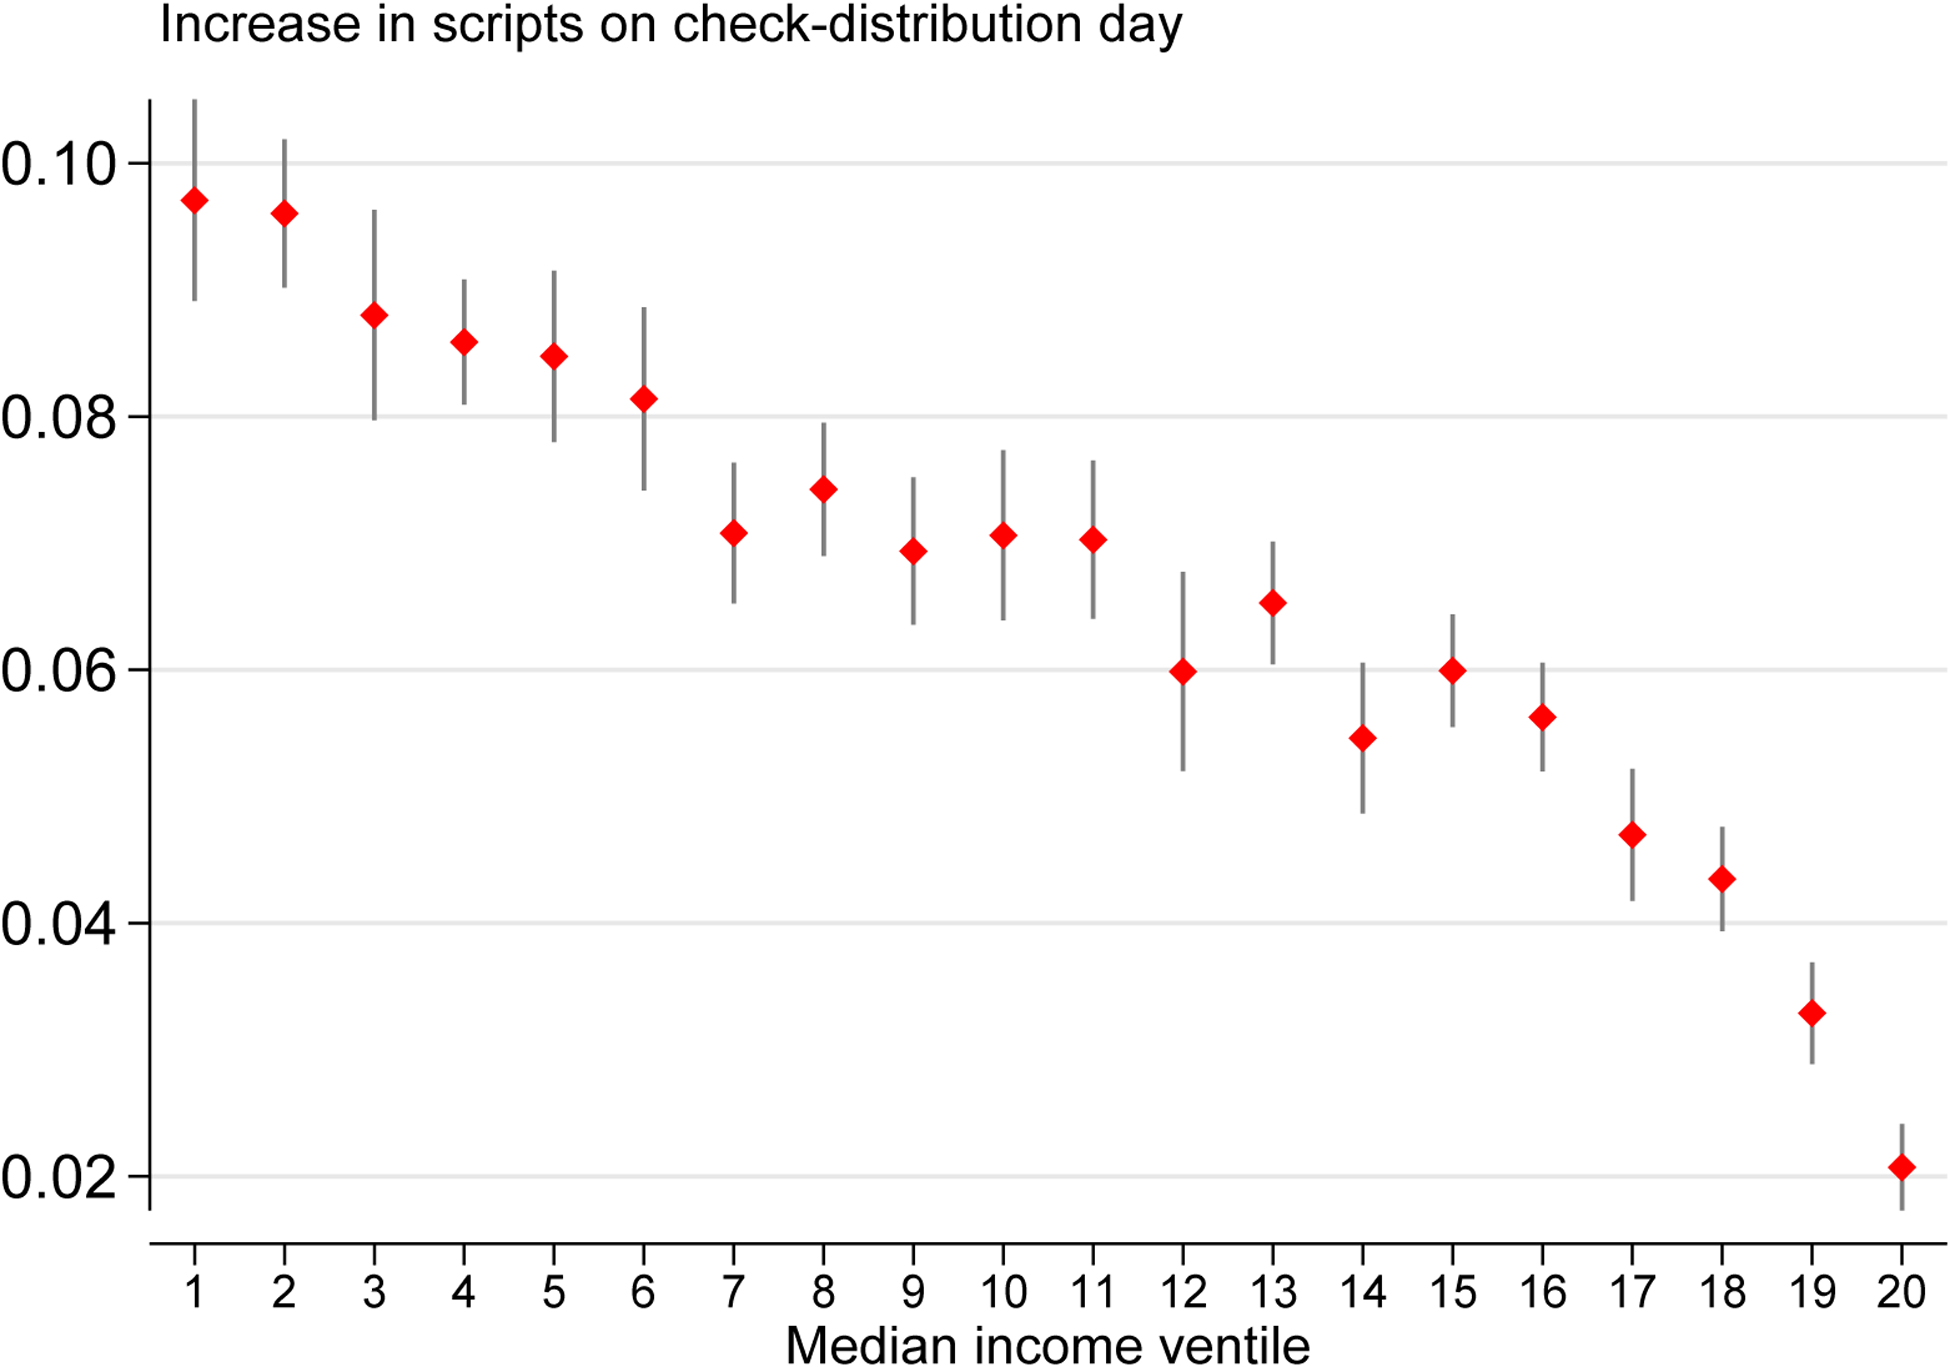
Figure 4. :

Heterogeneous Effects By Income
Note: This figure plots estimates of β0 from equation (1): the estimated event-study coefficient on check-distribution day for the logarithm of total scripts filled, by ventile of median income for each recipient’s ZIP Code of residence. The sample is restricted to the full-copay group. The vertical lines through each marker plot 95-percent confidence intervals based on standard errors that are clustered at the level of the birthday group.
