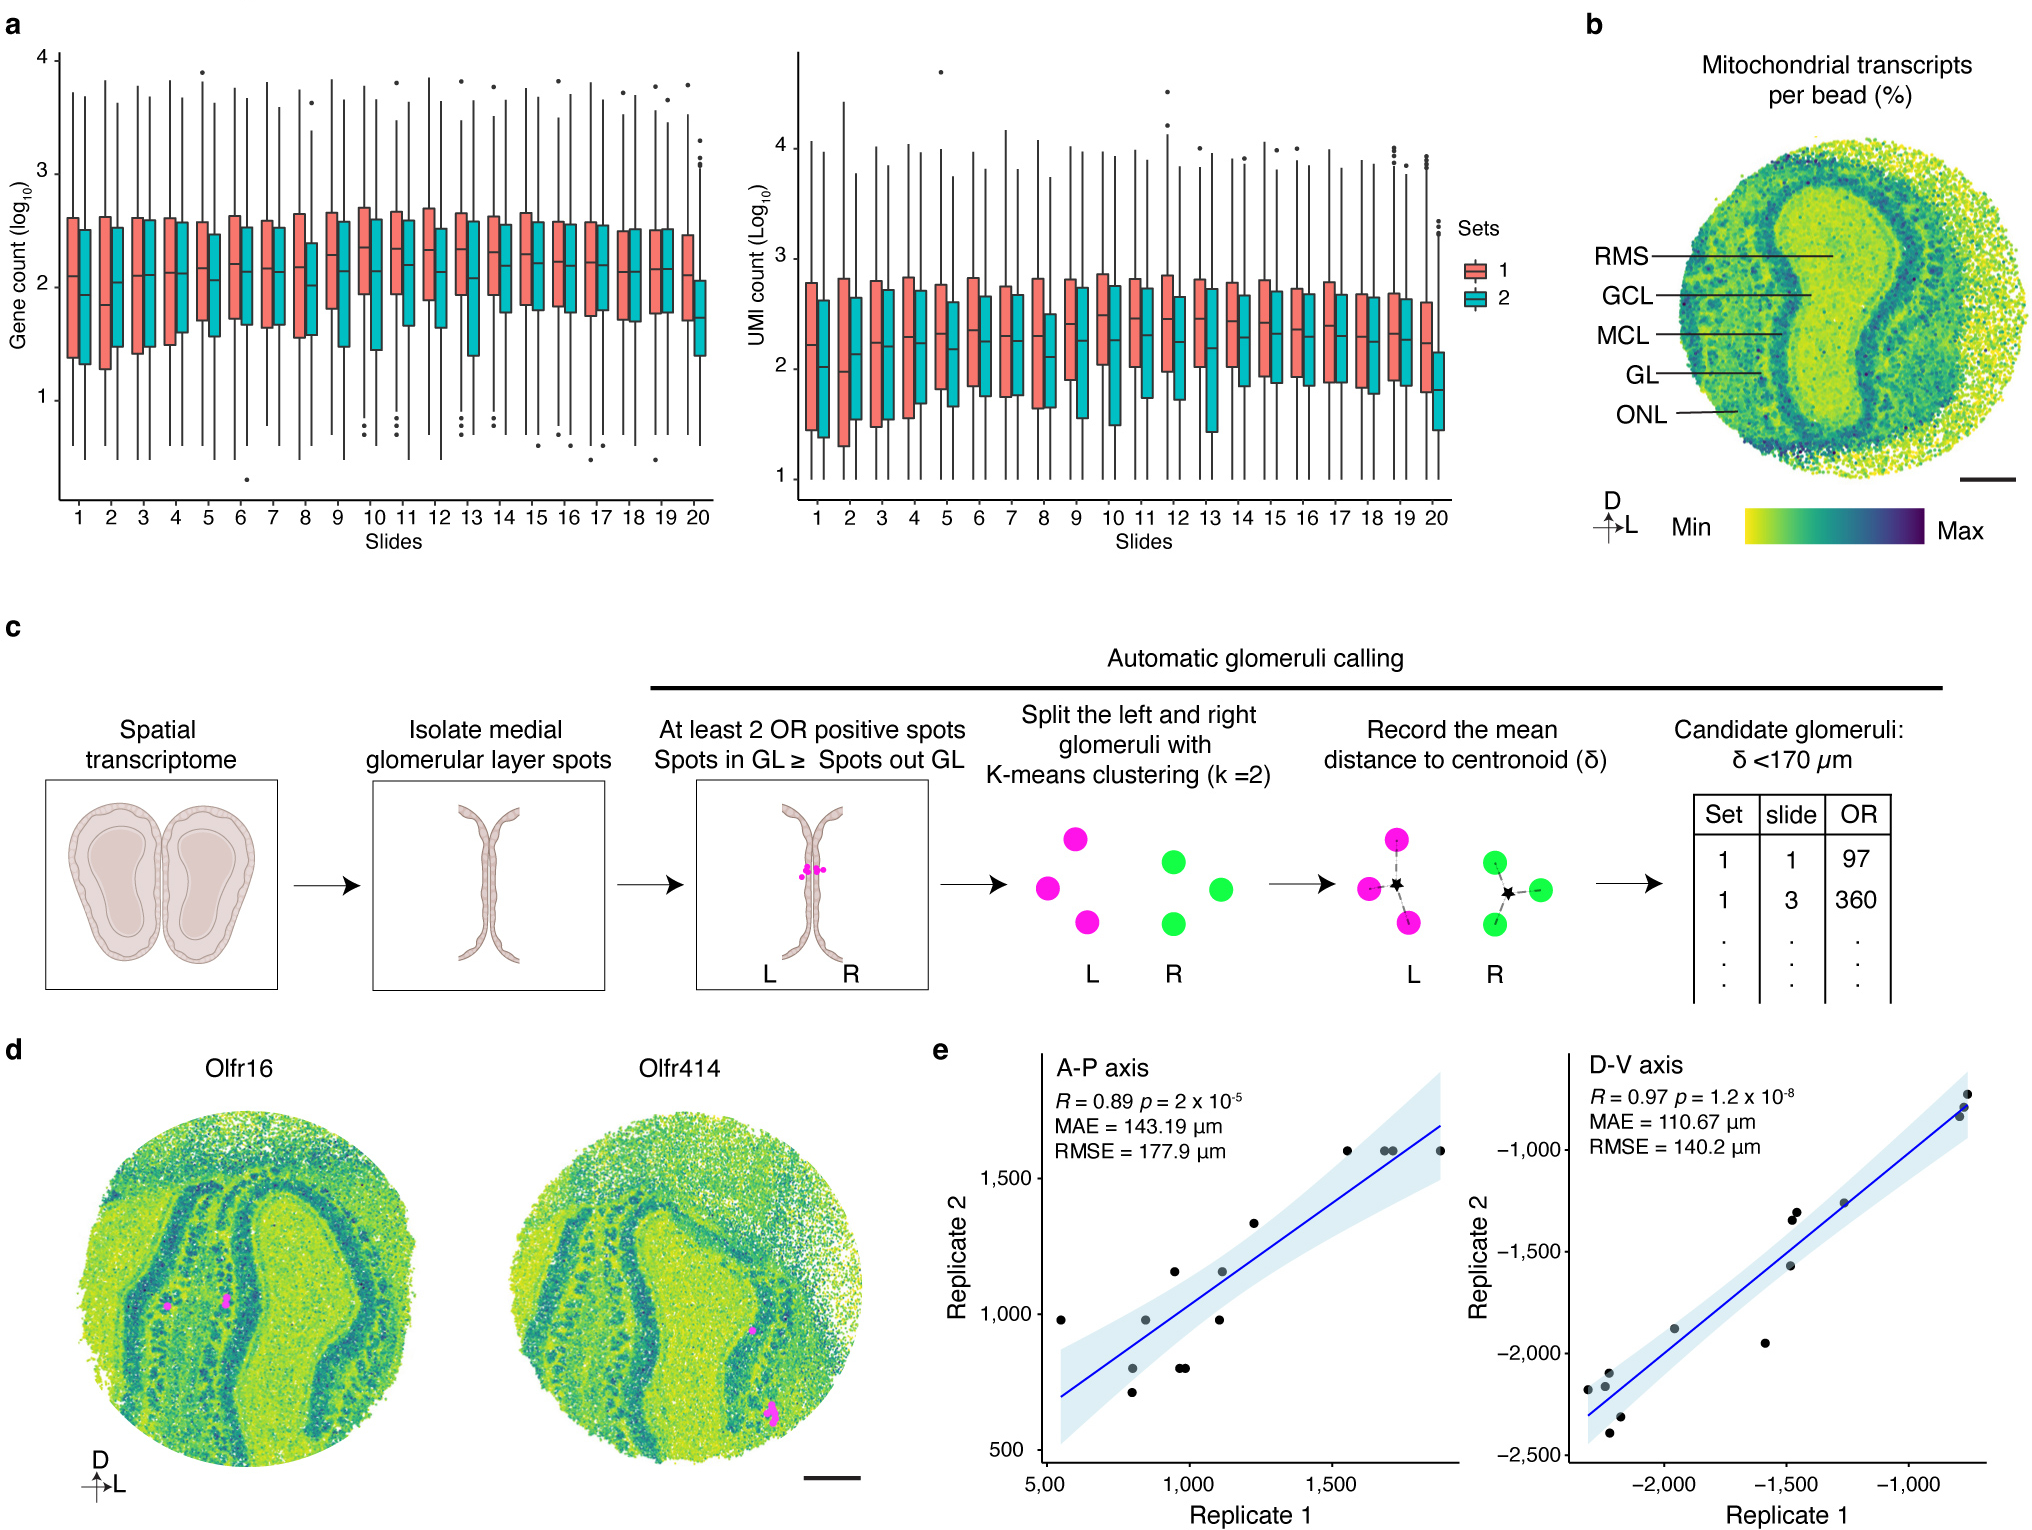
Extended Data Figure 6: Slide-seqV2 enables high quality spatial transcriptomic analysis of the mouse OB.

a, Plot of the number of genes (left panel) or UMIs (right panel) detected per bead on each slide of the Slide-seqV2 experiments (N ranges from 30041 to 56016, the exact number of beads on each individual slide is provided in Supplementary data 1), Boxplots indicate Q1–1.5*IQR, Q1, median, Q3, and Q3+1.5 *IQR; data beyond the whisker were plotted as individual dots. b, Mitochondrial transcript levels as a marker to define layer organization in the OB. Scale bar: 500 μm. c, Schematic of automated calling of glomerular positions in Slide-seqV2 experiments. d, Slide-seqV2 identified glomerular positions match glomerular positions that have been empirically determined. Scale bar: 500 μm. e, The glomerular positions of 14 ORs detected in two replicates of 20 Slide-seqV2 experiments exhibit high spatial correlation. 13 of the 14 glomerular positions identified in two, independent biological replicates were used as the anchors to align the two OBs. The held-out glomerulus was then transformed based on the anchors and the position was recorded. This process was iterated for all 14 glomeruli. The correlation between the position of the held-out glomeruli on the A-P and D-V axes across both replicates is shown. Data were fitted with a regression line (blue), +/− 95% CI (light blue).
