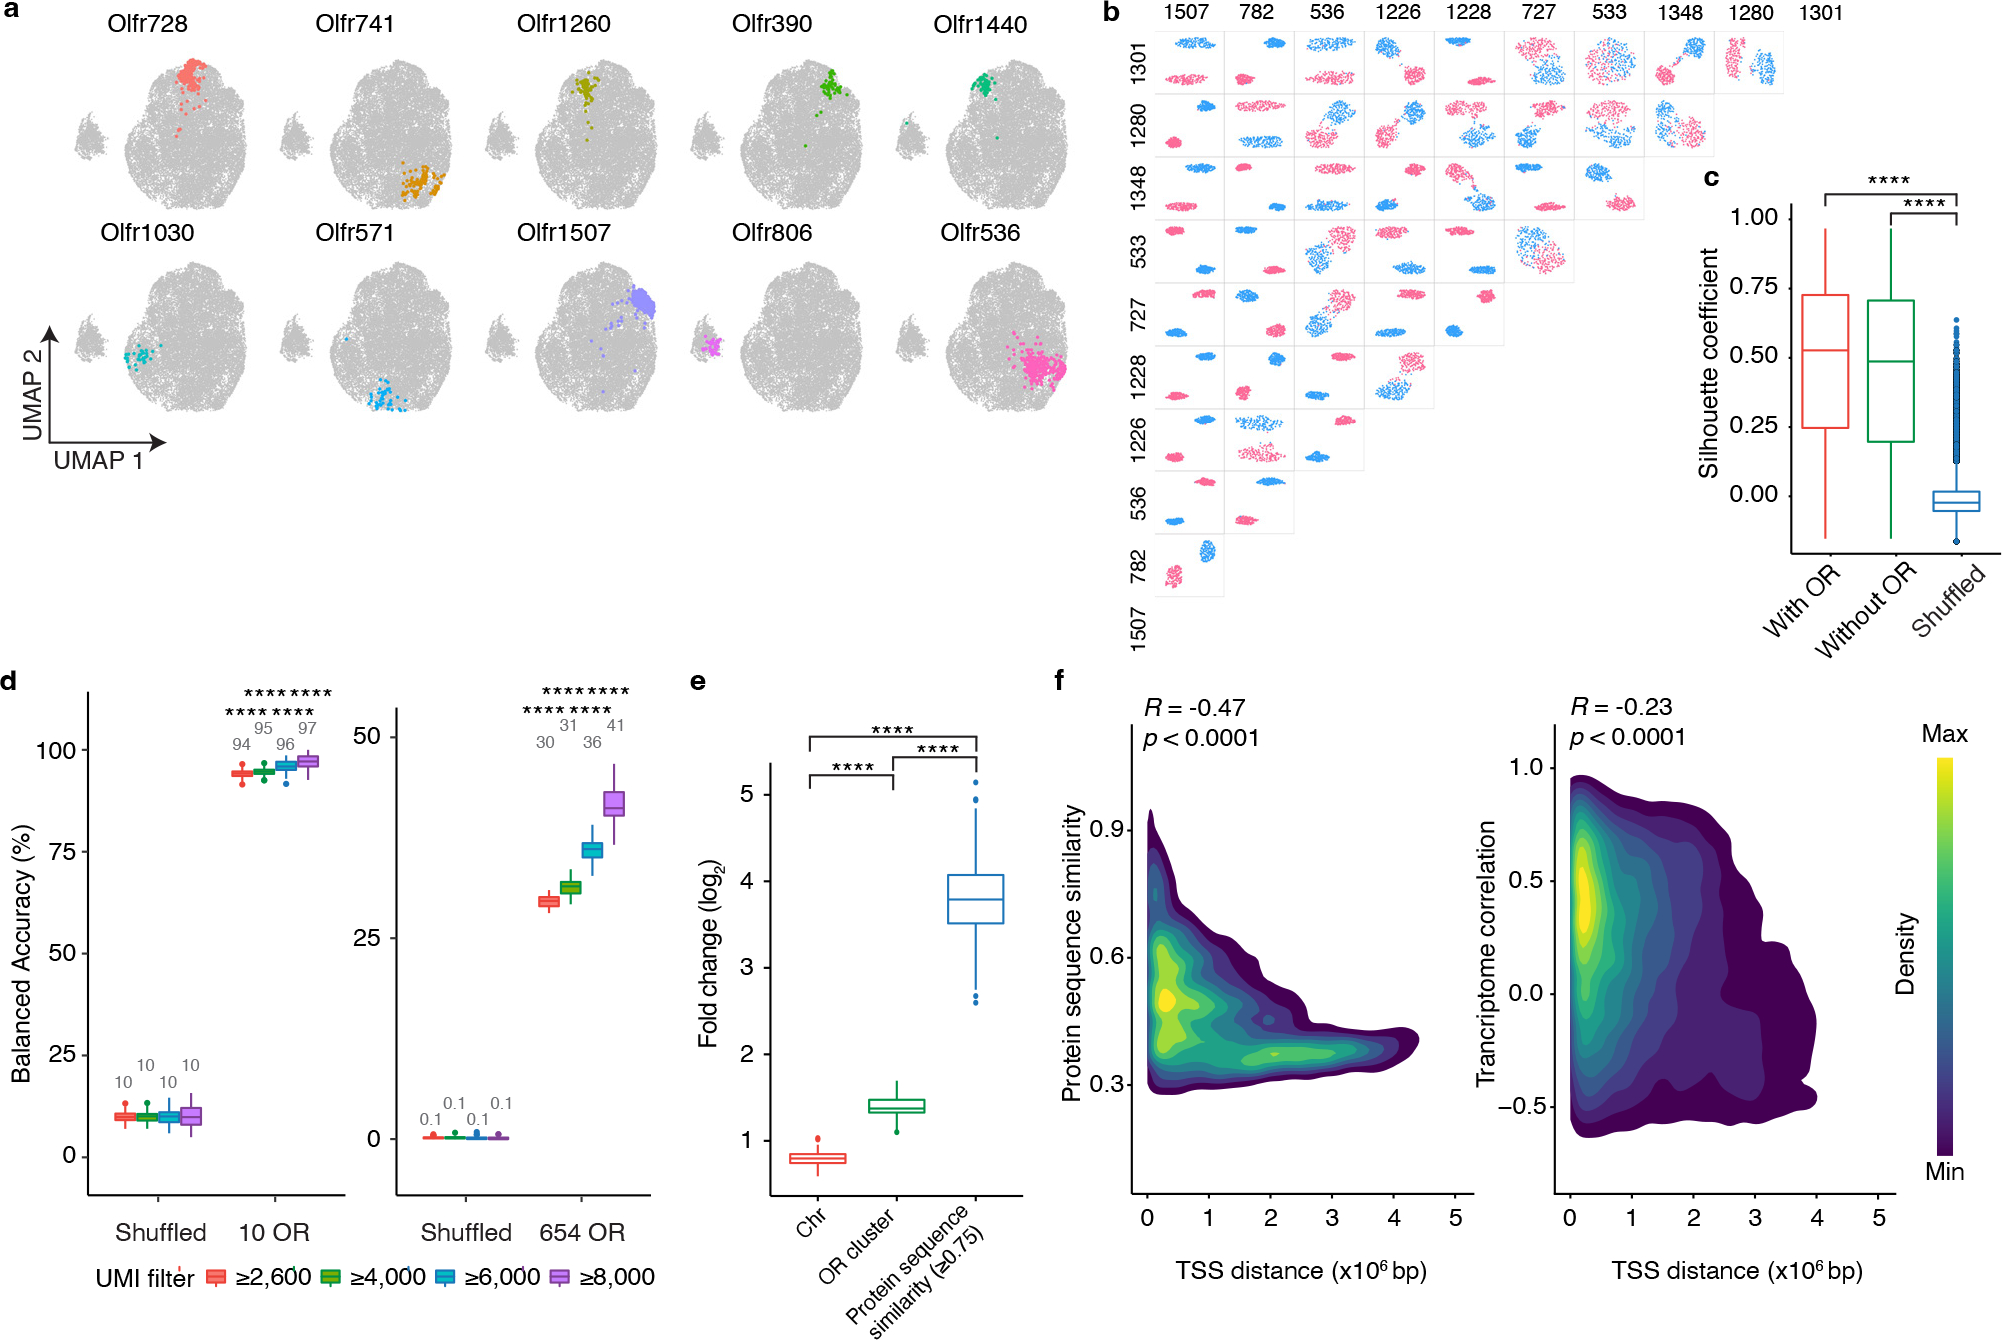
Figure 2: scRNAseq reveals that OSNs that display different ORs express unique transcriptional programs.

a, OSNs expressing each of ten random ORs are pseudo-colored on a UMAP plot. b, UMAP plots regenerated in a pairwise manner using each of the types of OSNs expressing the ten most frequently occurring ORs; OSNs expressing one OR are colored red and OSNs expressing the other OR are colored blue. c, To quantify the differences observed in location within UMAP space for different types of OSN, the Silhouette coefficients were calculated in a pairwise manner for all 654 types of OSN for which at least seven cells were sequenced using the complete gene expression matrix (with OR), the gene expression matrix with OR genes excluded (without OR), or the OR genes excluded expression matrix in which OR identity was randomly shuffled (Shuffled). N = 213,533 pairs, **** p < 0.0001 by two-sided Wilcoxon rank sum test, Benjamini-Hochberg correction was performed to account for multiple comparisons. d, SVM classifier analyses for OSNs expressing the 10 most frequently occurring OR types (left panel) and all 654 types of OSN for which at least seven cells were sequenced (right panel). Filtering OSNs that are inputted into the classifier with a unique molecular identifier (UMI) threshold increases the accuracy of the model. n = 100 independent tests, **** p < 0.0001 by two-sided Wilcoxon rank sum test comparing the actual data to the corresponding shuffled groups. e, The incorrect prediction results from d were collected and the likelihood for failed trials to be on the same chromosome, contained within the same genomic cluster, or to possess a protein similarity score > 0.75 with the observed OR was calculated. Data plotted as fold-change relative to chance. N = 100 independent tests, **** p < 0.0001 by two-sided Wilcoxon rank sum test, Benjamini-Hochberg correction was performed to account for multiple comparisons. f, Density map plot of the Pearson correlation between the genomic distance between the transcriptional start sites (TSS) of different ORs and their protein similarity score (left panel) or the transcriptome correlation of the OSNs that express those ORs (right panel). Only the genomic clusters containing at least 10 ORs were included in this analysis (N = 792 ORs on 19 clusters). Boxplots in this figure represent Q1 (quartile 1)-1.5*IQR (Interquartile range), Q1, median, Q3 (quartile 3), and Q3+1.5*IQR, data beyond the whisker were plotted as individual dots. Details of the statistical tests described in this figure are provided in Supplementary data 1.
