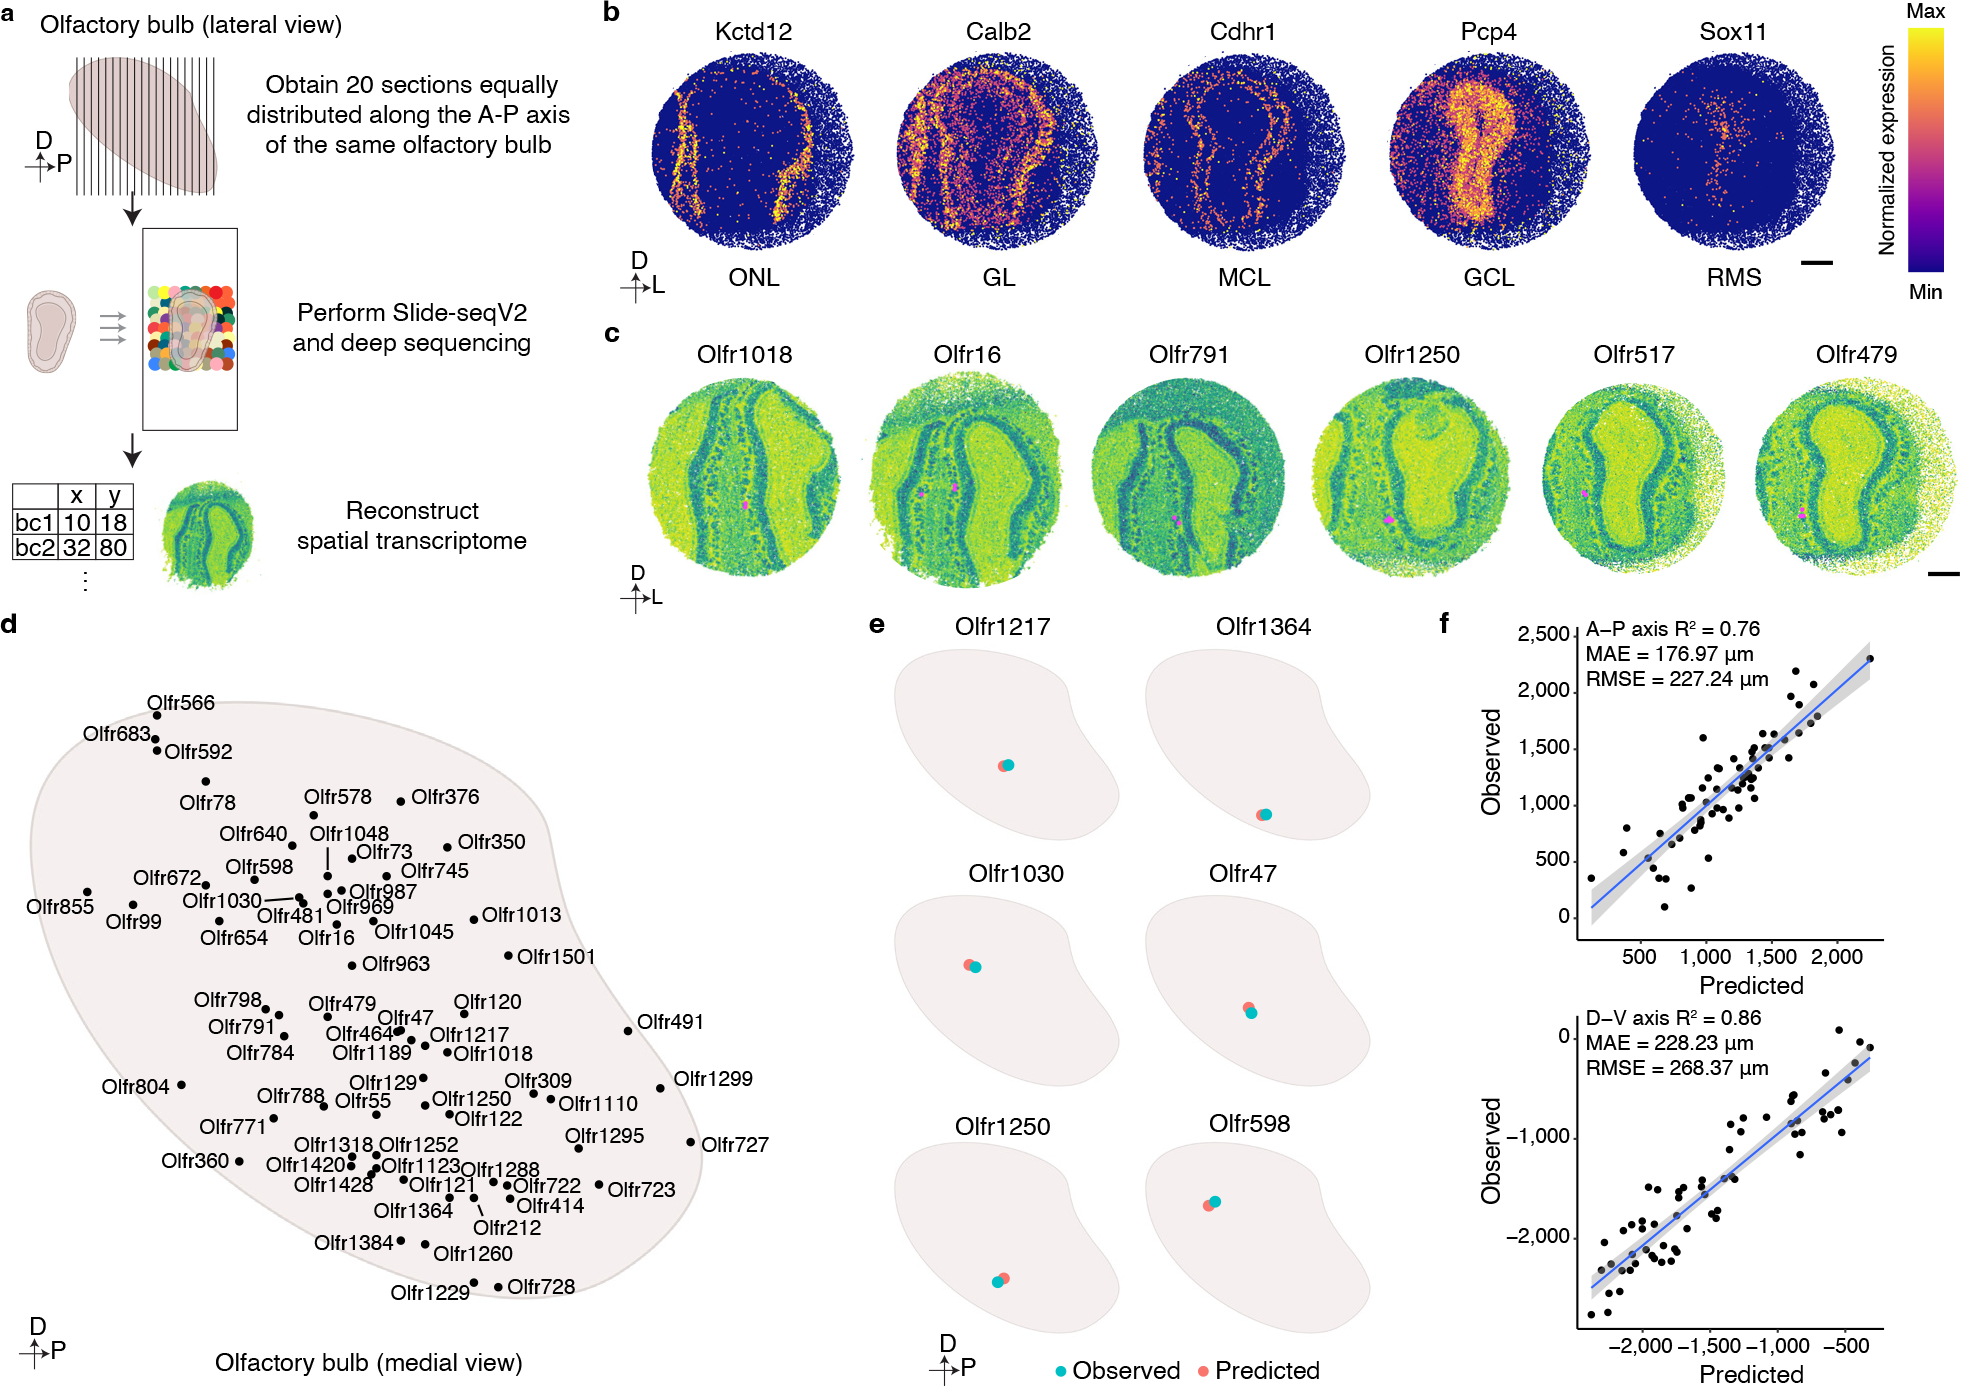
Figure 3: Spatial transcriptomic based reconstruction of the mouse glomerular map.

a, Schematic representation of the workflow used to generate a spatial transcriptomics-based reconstruction of gene expression within the mouse OB. Twenty sections evenly spaced along the anterior-posterior axis of the OB were subjected to Slide-seqV2 technology, and a custom analysis pipeline was then used to reconstruct a spatial transcriptomic map of the OB. b, Representative heatmaps of the expression of genes that define particular cellular layers within the OB: Kctd12-Olfactory Nerve Layer (ONL); Calb2-Glomerular Layer (GL); Cdhr1-Mitral Cell Layer (MCL); Pcp4-Granule Cell Layer (GCL); Sox11-Rostral Migratory Stream (RMS). Scale bar: 500 μm. c, Representative images of six glomeruli detected by our Slide-SeqV2 experiments. Instances in which proximal beads reveal expression of the same OR (magenta) were used to identify glomerular positions (see methods). Scale bar: 500 μm. d, Schematic representation of the positions of all the glomeruli identified through this spatial transcriptomics approach. e, A ridge regression model generated using the spatial transcriptomics-identified glomerular positions and the scRNAseq-determined OSN transcriptomes accurately predicts glomerular positions. Six different examples of the observed (blue) and predicted (red) glomeruli are depicted. f, Quantification of the accuracy of the ridge regression model for predicting glomerular position. The scatter plot depicts the positions of all 65 observed and predicted glomerular positions on both the anterior-posterior (upper panel) and dorsal-ventral (bottom panel) axes. Data were fitted with a regression line (blue) +/− SEM (light blue).
