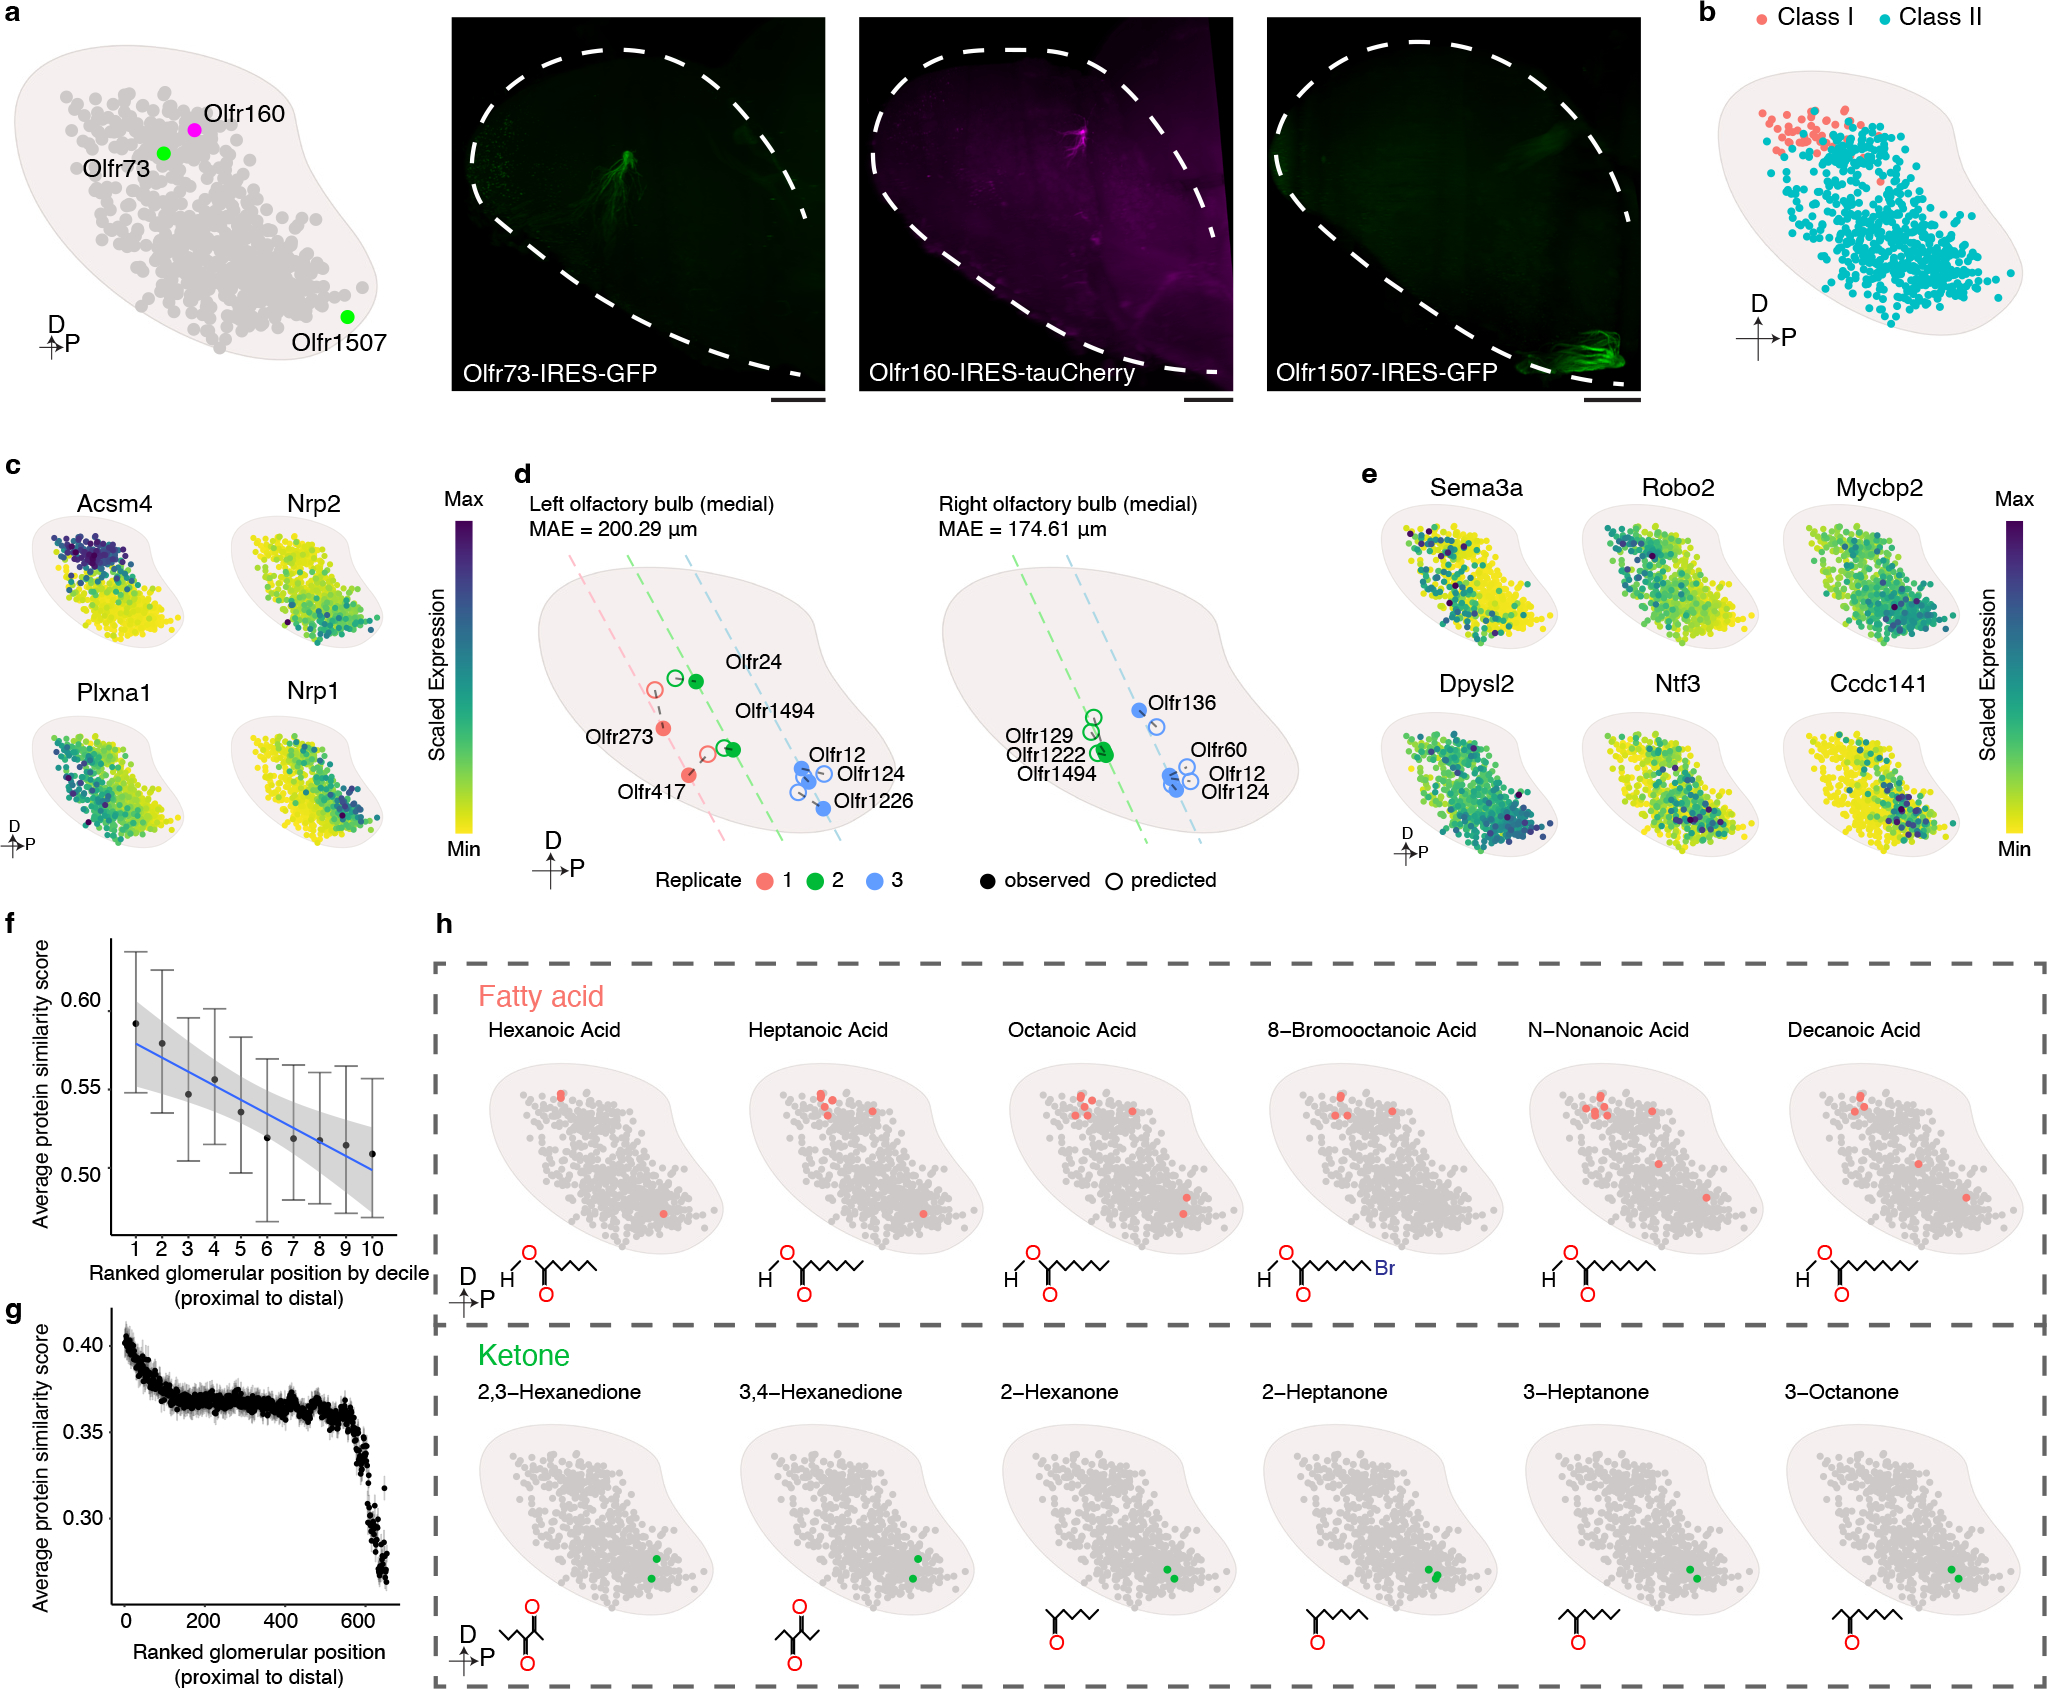
Figure 4: Organizing principles revealed through the reconstruction of a map of mouse glomerular positions.

a, Using mice harboring Olfr1507-IRES-GFP, Olfr160-IRES-tauCherry, or Olfr73-IRES-GFP alleles and light sheet microscopy we empirically determined that the locations of these three glomeruli (right panels) are consistent with our prediction (left panel). Similar results were observed from each mouse line with at least 3 biological repeats. Scale bar: 500 μm. b, The distribution of Class I (Red)- and Class II (Blue) glomeruli on the predicted glomerular map. c, Scaled expression of Acsm4, Nrp2, Plxna1, and Nrp1. d, Location of the indicated glomeruli determined by MERFISH (●) relative to their position predicted by the model (○). Dashed line indicates the slide position. e, Scaled expression of axon guidance genes obtained from the scRNAseq data for each of the OSNs that form glomeruli in our model. f, Glomeruli formed by OSNs expressing ORs from the same genomic cluster (only the clusters with at least 10 corresponding glomeruli detected were included, N = 19) were iteratively rank ordered according to their distance from each other and then the average protein sequence similarity was calculated for each ranked glomerular position. To enable comparison across genomic clusters that contain different numbers of ORs, glomerular position was binned by decile and calculated for each genomic cluster separately. The data are presented as the mean +/− bootstrapped 95% CI. Data were fitted with a linear model (blue), and the +/− 95% CI (gray). g, Glomeruli (N = 654) were iteratively rank ordered according to their distance from each other, and the average protein sequence similarity was calculated for each ranked glomerular position. The data are presented as the mean +/− bootstrapped 95% CI. h, Published databases of the chemoreceptive fields of mouse ORs were used to create a schematic representation of the glomeruli that respond to the indicated fatty acid (green) and ketone (red) odorants.
