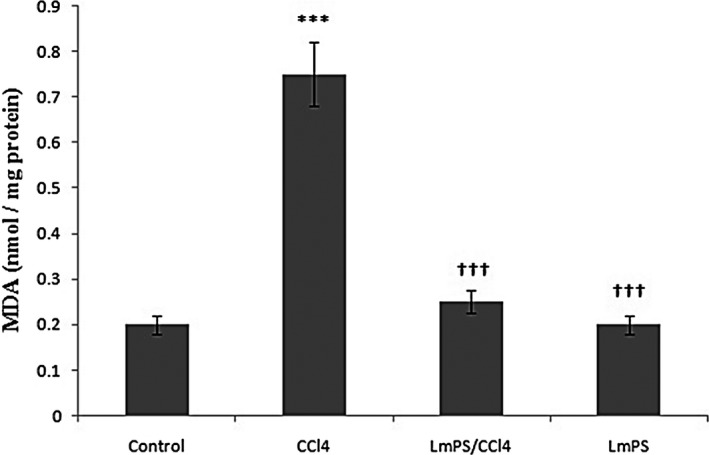
FIGURE 6.

Effects of CCl4, LmPS (Lin) and their combination on hepatic MDA of control and experimental rats. Data show mean ± SEM values of three independent experiments. *** p < .001 indicates significant differences compared to CCl4 group versus control. ††† p < .001 indicates significant differences compared to LmPS group versus CCl4
